The Average Rate of Change Formula, Explained
By ToolNimba Editorial Team June 20, 2026 9 min read
Quick answer
The average rate of change formula is (f(b) - f(a)) / (b - a). It measures how much a function's output changes per unit of input between two points, and it equals the slope of the straight line connecting those two points on the curve.
The average rate of change tells you the typical speed at which something changes over an interval, not at a single instant. If a quantity grows from one value to another between two inputs, this formula gives the steady rate that would carry it from start to finish. It is one of the most useful ideas in algebra and the gateway to calculus.
What the average rate of change formula means
Given a function f and two input values a and b, the average rate of change over the interval from a to b is (f(b) - f(a)) / (b - a). The top of the fraction is the change in output, how much the function value rose or fell. The bottom is the change in input, how far you moved along the horizontal axis. Dividing one by the other gives change in output per unit of input.
If you have seen the slope formula, this should look familiar. Slope is (y2 - y1) / (x2 - x1), and the average rate of change is exactly the same idea written in function notation. Here f(a) and f(b) are simply the y values at the inputs a and b. So the average rate of change is rise over run between two points on a curve.
Why it equals the slope of a secant line
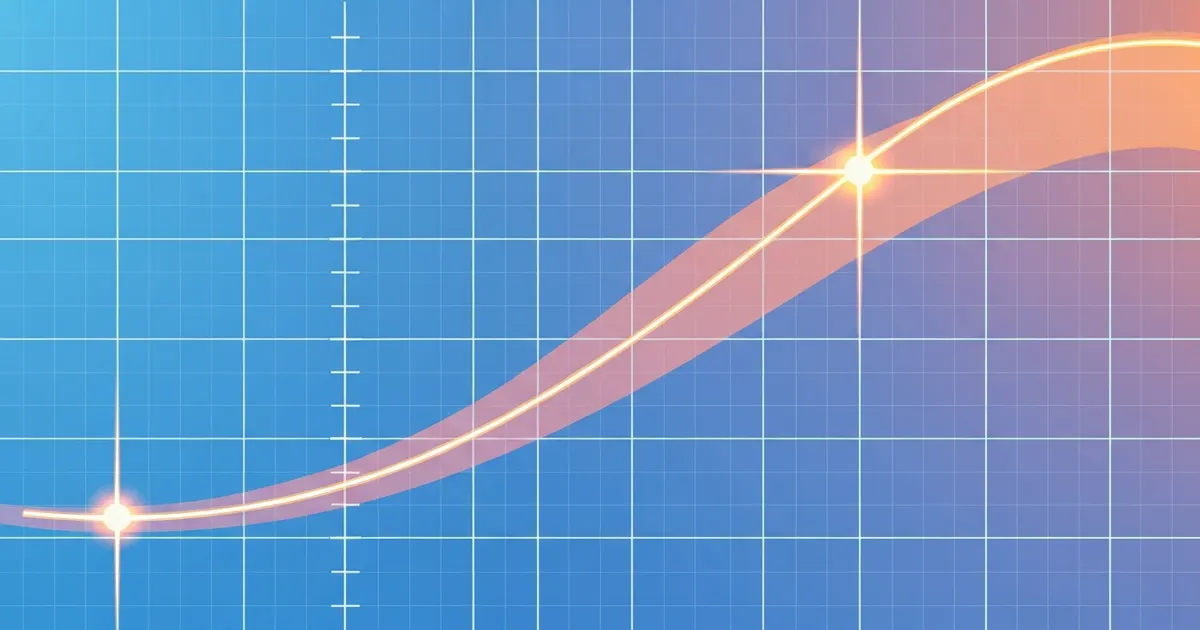
A curve usually changes steepness as you move along it, so it has no single slope. To measure an overall trend, you draw a straight line through two points on the curve. That straight line is called a secant line, and the average rate of change is its slope.
Imagine a road that is gentle at the bottom and steep near the top. Your instantaneous steepness changes constantly, but if you only care about the average climb from the bottom to the top, you connect those two points with one straight line and measure its slope. The curve might wander above and below that line in between, yet the secant captures the net rate of change across the whole interval.
How to use the formula step by step
Suppose f(x) = x squared, and you want the average rate of change from x = 1 to x = 4. Here is how to work it out.
- Identify a and b. The interval runs from a = 1 to b = 4, so these are your two input values.
- Evaluate f(a). Plug in a = 1: f(1) = 1 squared = 1.
- Evaluate f(b). Plug in b = 4: f(4) = 4 squared = 16.
- Find the change in output. Subtract: f(b) - f(a) = 16 - 1 = 15.
- Find the change in input. Subtract: b - a = 4 - 1 = 3.
- Divide. The average rate of change is 15 divided by 3, which equals 5.
So over the interval from 1 to 4, the function f(x) = x squared rises by an average of 5 units of output for every 1 unit of input. A straight secant line through the points (1, 1) and (4, 16) would have a slope of exactly 5.
A real-world worked example with units
The formula becomes far more meaningful once the inputs and outputs carry real units. Suppose a car is 60 kilometers from home after 1 hour and 240 kilometers from home after 4 hours. The average rate of change of distance with respect to time is its average speed. Here is the same six step process applied to data instead of a clean function.
- Identify a and b. The interval runs from a = 1 hour to b = 4 hours.
- Read the output at a. The distance at 1 hour is f(a) = 60 kilometers.
- Read the output at b. The distance at 4 hours is f(b) = 240 kilometers.
- Change in output. f(b) - f(a) = 240 - 60 = 180 kilometers.
- Change in input. b - a = 4 - 1 = 3 hours.
- Divide and keep the units. 180 kilometers divided by 3 hours equals 60 kilometers per hour.
The answer is 60 kilometers per hour, the average speed for the trip. Notice that the units come straight from the formula: output units over input units, here kilometers over hours. Always carry the units through, because "60" alone means nothing while "60 kilometers per hour" is a complete, checkable answer. This is the same logic that drives the velocity formula.
How to find the average rate of change from a graph or table
On a test you are often handed a graph or a table of values rather than a tidy equation. The method does not change, only where you read the numbers from.
From a graph, find the two points where your interval starts and ends, read off their coordinates at clear grid intersections, then compute rise over run. From a table, pick the two rows that bookend your interval, subtract the output column values for the top of the fraction, subtract the matching input column values for the bottom, and divide. The table below shows a quick example you can read straight across.
Reading average rate of change from a table of values for f(x)
| Interval | f(a) | f(b) | Output change | Input change | Average rate |
|---|---|---|---|---|---|
| x = 0 to x = 2 | 3 | 11 | 8 | 2 | 4 |
| x = 2 to x = 5 | 11 | 26 | 15 | 3 | 5 |
| x = 5 to x = 9 | 26 | 2 | -24 | 4 | -6 |
Each row uses only the two endpoints of its interval, never the values in between. The third row shows a negative result because the output dropped from 26 down to 2, so the function was decreasing on average across that stretch.
Average rate of change versus instantaneous rate
It helps to see how the average rate sits next to its close cousin, the instantaneous rate. The table below lines up the key differences so you can choose the right tool.
Average rate of change compared with instantaneous rate of change
| Feature | Average rate of change | Instantaneous rate of change |
|---|---|---|
| What it measures | Change over an interval | Change at a single point |
| Geometry | Slope of a secant line | Slope of a tangent line |
| Formula | (f(b) - f(a)) / (b - a) | The derivative f prime of x |
| Math level | Algebra and precalculus | Calculus |
| Inputs needed | Two points | One point plus a limit |
| Everyday meaning | Average speed over a trip | Speedometer reading right now |
As the two input points move closer and closer together, the secant line approaches the tangent line, and the average rate of change approaches the instantaneous rate. That limiting process is the heart of differential calculus, but you do not need calculus to use the average rate of change itself.
Where average rate of change shows up
This formula is the math behind any "per unit" measurement that compares a start and an end. It appears far beyond the math classroom.
- Average speed. Distance traveled divided by time elapsed is an average rate of change of position, the same idea behind the velocity formula.
- Population growth. The change in population divided by the change in years gives the average growth rate over that span.
- Business and finance. Revenue change per quarter, or cost change per unit produced, are average rates of change you can read off a chart.
- Temperature trends. How many degrees a city warms per hour is the average rate of change of temperature over that window.
- Science data. Concentration change per minute in a reaction or fuel burned per mile are all the same ratio in different clothes.
What the sign of the answer tells you
The number alone is only half the story. Its sign describes the overall direction of the function across the interval, so read it before you move on.
- Positive means the output rose on average, so the function is increasing across the interval and the secant line slopes upward from left to right.
- Negative means the output fell on average, so the function is decreasing and the secant line slopes downward, like a cooling cup of coffee or a draining tank.
- Zero means the output ended exactly where it started. The function may have moved up and down in between, but the net change over the interval is nothing, and the secant line is horizontal.
Because the result reflects only the two endpoints, a zero average rate of change does not mean nothing happened. It only means the start and end values matched. This is closely related to how percent change compares a beginning and ending value rather than the path between them.
Common mistakes to avoid
Most errors come from setup slips, not hard arithmetic. Keep an eye out for these.
- Mixing the order. If f(b) leads the top of the fraction, then b must lead the bottom. Subtracting outputs one way and inputs the other way flips the sign and gives the wrong answer.
- Plugging inputs into the output slots. The top is f(b) - f(a), the function values, not b - a again. Always evaluate the function first.
- Forgetting the sign. If the function falls over the interval, the average rate of change is negative. Dropping the minus turns a decline into a rise.
- Confusing it with the instantaneous rate. The average rate uses two points and gives one number for the whole interval. It is not the slope at a single point.
- Reading points off a graph carelessly. Use clear grid intersections so your input and output values are exact, just as you would when finding the percent change between two readings.
Good to know: linear functions are special
For a straight line, the average rate of change is the same over every interval, because a line has one constant slope everywhere. Pick any two points and you get the identical number. That constant value is just the slope m in the equation y = mx + b.
Curved functions behave differently. For f(x) = x squared, the average rate of change from 1 to 4 was 5, but from 1 to 2 it is only 3, and from 4 to 5 it climbs to 9. The rate depends on which interval you choose, which is exactly why you must always state both endpoints. The average rate of change also pairs naturally with coordinate tools like the midpoint formula and the distance formula when you study segments and curves.
Calculate it instantly
Because the average rate of change is just the slope between two points, you can compute it fast. Enter the coordinates (a, f(a)) and (b, f(b)) below and the slope calculator returns the rate, shows the rise and run, and tells you whether it is rising or falling.
📐 Try the free tool Slope Calculator Free slope calculator. Enter two points to find the slope (gradient), the line equation y = mx + b, the distance between the points, and the angle of incline.The average rate of change formula rewards a calm, consistent setup: evaluate the function at both endpoints, subtract the outputs for the top, subtract the inputs for the bottom, and divide. Keep the subtraction order matched, respect the sign, and remember that it is the slope of the secant line between two points. With those habits, average rate of change becomes a dependable bridge from algebra into calculus.
Frequently asked questions
What is the average rate of change formula?
The average rate of change formula is (f(b) - f(a)) / (b - a). You evaluate the function at two inputs a and b, subtract the outputs for the top, subtract the inputs for the bottom, then divide. The result is the slope of the straight line connecting those two points on the curve.
Is the average rate of change the same as slope?
Yes. The average rate of change between two points is exactly the slope of the line through them, written in function notation. Slope is (y2 - y1) / (x2 - x1), and the average rate of change is (f(b) - f(a)) / (b - a), which is the same rise over run idea.
What is the difference between average and instantaneous rate of change?
The average rate of change measures change over an interval using two points, and it equals the slope of a secant line. The instantaneous rate measures change at a single point, equals the slope of a tangent line, and requires calculus to find using the derivative.
Can the average rate of change be negative?
Yes. If the function's output is lower at the end of the interval than at the start, the average rate of change is negative. A negative value means the quantity is decreasing on average over that interval, like a temperature falling or a balance shrinking.
Does the average rate of change depend on the interval?
For curved functions, yes. Different intervals usually give different average rates of change, which is why you must always state both endpoints. For a straight line it is the opposite: the average rate of change is constant and equals the line's slope on every interval.
How do I find the average rate of change from a table?
Pick the two rows that mark your interval. Subtract the output values to get the change in the function, subtract the matching input values to get the change in the input, then divide the output change by the input change. The quotient is the average rate of change.
How do I find the average rate of change from a graph?
Locate the two points where your interval begins and ends, then read their coordinates at clear grid intersections. Compute the rise, the change in the vertical values, and the run, the change in the horizontal values. Divide rise by run, and that slope of the secant line is your average rate of change.
What are the units of the average rate of change?
The units are the output units divided by the input units. If distance in kilometers changes over time in hours, the answer is in kilometers per hour. Always carry the units through the division, since a bare number like five means nothing without them.