Best Business Intelligence Tools in 2026: 10 Tools Compared
By ToolNimba Editorial Team October 30, 2026 12 min read

- Top pick
 Microsoft Power BI
Microsoft 365 teams on a budget
Starting price$14 per user per monthCheck out Microsoft Power BIRead our review - Runner-up
 Tableau
Visual exploration for analysts
Starting price$15 per user per monthCheck out TableauRead our review - Also great
 Looker Studio
Free Google dashboards
Starting priceFreeCheck out Looker StudioRead our review
How we researched this
We compared official pricing and feature pages, app store listings, privacy policies and public user reviews. Prices change, so check the provider's site before you pay.
Key takeaways
- Power BI is the value leader for Microsoft shops, while Tableau still leads on visual exploration for skilled analysts.
- Looker Studio is the cheapest way to start, and Metabase gives small teams real BI without a large license bill.
- Looker, Domo, and Sisense suit larger or embedded use cases, but expect custom pricing and longer setup.
- Budget for viewers as well as builders, since seat costs for everyone who reads a dashboard often drive the total bill.
Quick comparison
| Name | Best for | Starting price | Free plan | |
|---|---|---|---|---|
| Microsoft Power BI | Microsoft 365 teams on a budget | $14 per user per month | Yes | Visit |
| Tableau | Visual exploration for analysts | $15 per user per month | Free trial (14 days) | Visit |
| Looker Studio | Free Google dashboards | Free | Yes | Visit |
 Qlik Sense | Associative data exploration | $30 per user per month | Free trial (30 days) | Visit |
 ThoughtSpot | Search-driven analytics | $25 per user per month | Free trial (14 days) | Visit |
 Domo | Cloud dashboards plus data apps | See website | Free trial (30 days) | Visit |
 Sisense | Embedded analytics in products | See website | Free trial (14 days) | Visit |
 Zoho Analytics | Small business BI on a budget | $24 per month | Yes | Visit |
 Metabase | Open source and simple BI | Free | Yes | Visit |
 Amazon QuickSight | AWS teams and embedded dashboards | See website | Free trial (30 days) | Visit |
The best business intelligence tools
We focused on tools that connect to real business data, build dashboards people actually read, and scale from a small team to a larger company without a rebuild.
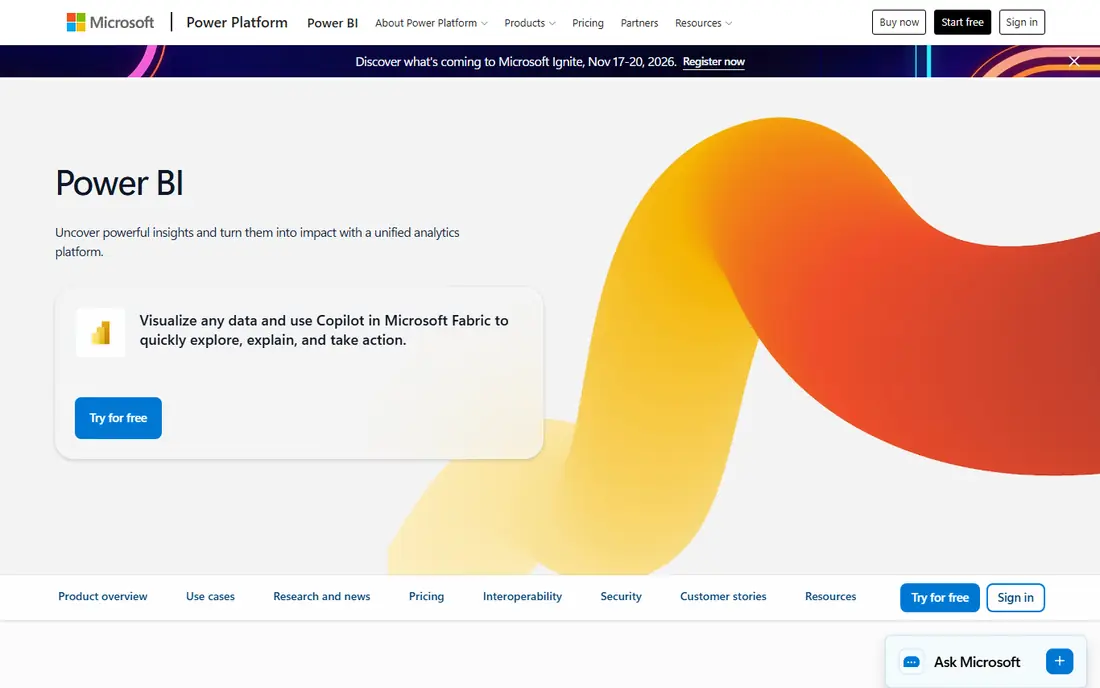
Power BI is the default shortlist pick for any team already living in Microsoft 365. Pro starts at $14 per user per month, Desktop is free for building reports, and dashboards drop naturally into Teams, Excel, and SharePoint. For a small or midsize business that already pays for Microsoft tools, that fit is hard to argue against.
The catch is licensing detail. Who can view, who can share, and when you need Premium capacity all affect the bill, and those rules change with team size. Copilot and some advanced features also need capacity beyond a basic Pro seat. Still, if your data sits in Excel, SQL Server, or Azure, Power BI usually gives the most value per dollar.
- Low entry price for Pro
- Deep Excel, Teams, and Microsoft 365 integration
- Large connector library and strong community
- Sharing rules and capacity costs can confuse new buyers
- Advanced AI features need paid capacity
- Viewer licensing adds up
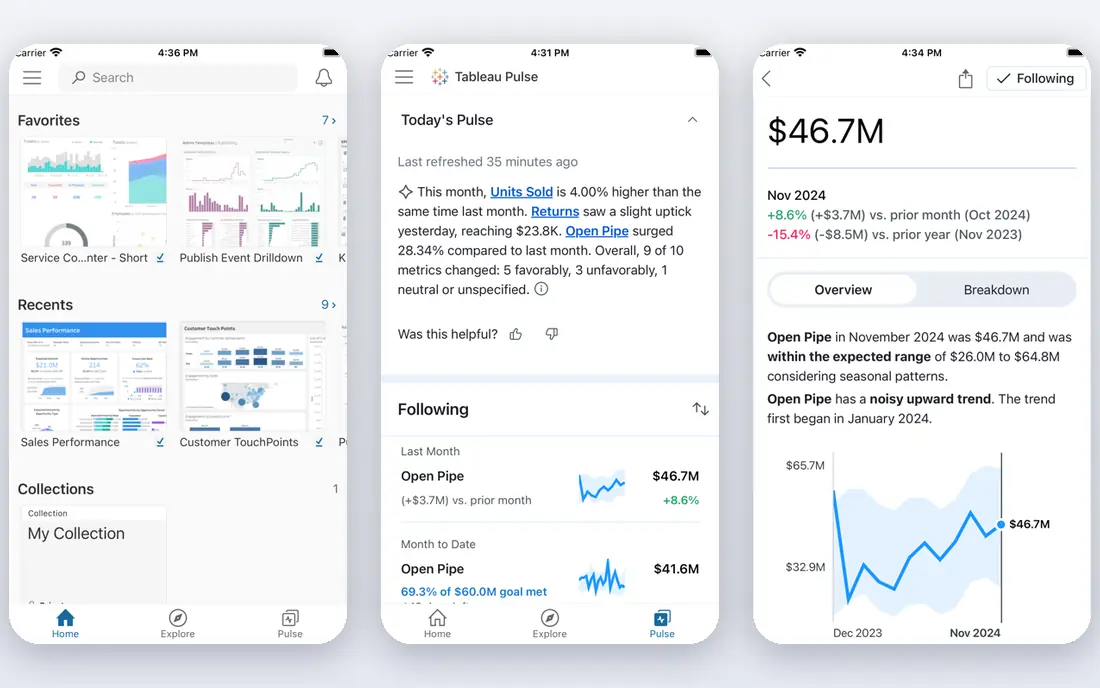
Tableau, now part of Salesforce, remains the visual exploration leader. Analysts can drag fields onto a canvas, test ideas quickly, and build dashboards that invite readers to filter and drill down rather than stare at a static chart. Viewer pricing starts at $15 per user per month, while Explorer and Creator roles cost more, so the mix of roles shapes the total.
That power comes with a learning curve and a higher bill than Power BI for many teams. Casual readers may never use the deeper features, and a messy data source will still produce a pretty but misleading dashboard. Choose Tableau when visual analysis is a daily job for your team, not an occasional report.
- Best-in-class interactive visuals
- Flexible calculations and dashboard design
- Large community and learning resources
- Total cost rises with role mix
- Needs skilled users to get full value
- Governance takes planning at scale
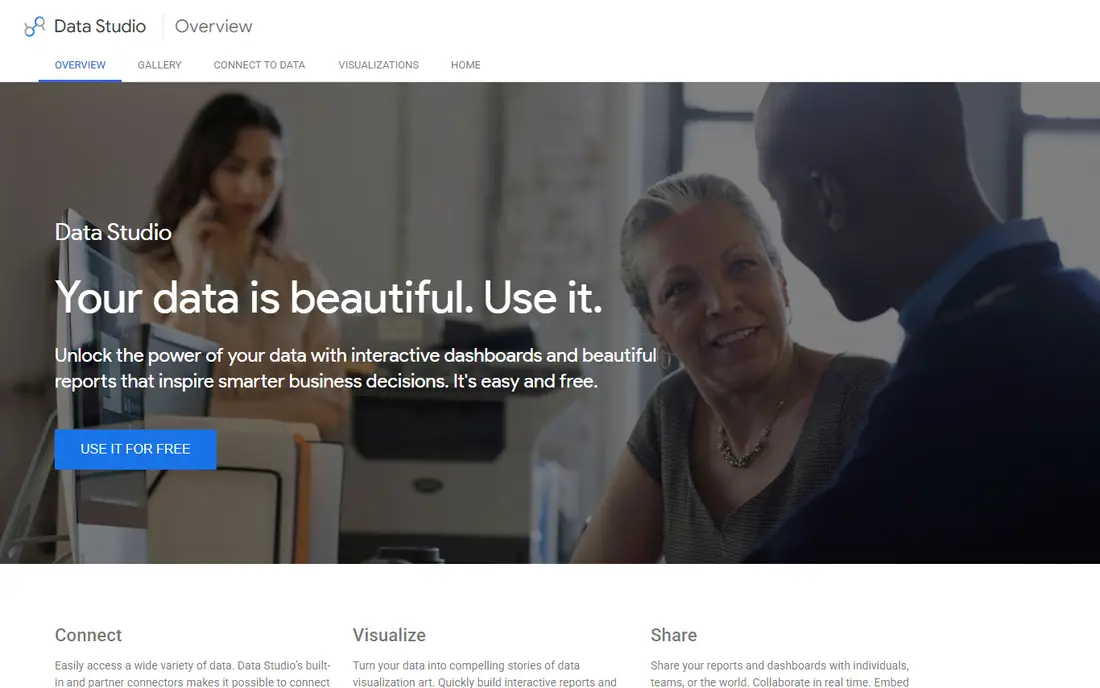
Looker Studio is the fastest free start in BI. If your data lives in Google Sheets, Google Analytics, or BigQuery, you can build a clean dashboard in an afternoon and share it with a link. There is no license hurdle for a small team, a freelancer, or a nonprofit testing its first reporting habit.
It is not a full enterprise BI platform. Data modeling is lighter than Looker, governance controls are thinner, and complex blends can get fragile. Pro, at $9 per user per project per month in recent listings, adds team features and Gemini help. For simple, shared reporting, though, Looker Studio beats paying for a heavy platform you will barely use.
- Free for core reporting
- Easy Google Analytics, Sheets, and BigQuery connections
- Simple sharing with a link
- Limited data modeling and governance
- Pro features cost extra
- Weaker for large enterprise BI programs
Qlik Sense takes a different approach to exploration. Its associative engine lets users click a value and instantly see what is related, what is excluded, and what else might matter, without following a fixed drill path. That helps analysts spot patterns they would not have thought to query, especially in sales, operations, and finance data with many linked dimensions.
The trade-off is effort up front. Data loading, modeling, and app design need care, and pricing has shifted between business and enterprise tiers over time, so confirm the current plan before budgeting. For teams that value free-form exploration over preset reports, Qlik Sense is still one of the strongest choices.
- Associative engine surfaces related data without preset queries
- Strong self-service exploration
- Good mobile dashboards
- Pricing tiers can be confusing
- Setup and data modeling take effort
- Interface feels less modern than some rivals
ThoughtSpot is built for people who do not want to learn a BI tool. A sales manager can type a question in plain English, such as sales by region last quarter, and get a chart plus follow-up suggestions. That search-first style lowers the barrier for executives and frontline teams who would never open a traditional report builder.
It only works as well as the data underneath it. If metrics are defined differently across teams, search will return confident but inconsistent answers. ThoughtSpot Essentials has been listed from $25 per user per month, with higher tiers by quote. Pick it when your goal is self-service answers for many readers, not pixel-perfect dashboards for a few analysts.
- Plain-language search for non-technical users
- AI-assisted answers and explanations
- Fast time to insight for business teams
- Needs clean, well-modeled data to shine
- Custom pricing on higher tiers
- Less control for deep dashboard design
Domo pitches itself as more than a dashboard tool, and for larger teams that pitch holds up. It bundles data connectors, preparation tools, dashboards, and low-code data apps in one cloud platform, so a company can move from raw sources to an executive view without stitching together five vendors. Mobile dashboards and alerts are also strong for leaders on the move.
Pricing is the hurdle. Domo is largely quote-based and consumption can affect cost, so a small team will struggle to budget from a public price page. Request a scoped quote based on users, data volume, and refresh needs, and compare the total against Power BI or Tableau before committing. For midsize and larger firms that want one cloud home for data, Domo is worth that conversation.
- All-in-one cloud platform with connectors, ETL, and dashboards
- Strong executive and mobile views
- Data apps beyond static reports
- Custom and consumption-based pricing is hard to forecast
- Can be costly for small teams
- Implementation needs planning
Sisense is a favorite for software companies that want analytics inside their own product. Customers can view dashboards without leaving the app, branding can match the host product, and APIs give developers control over embedding and permissions. It also handles large data volumes and varied sources better than lighter tools.
That strength makes it a poor fit for a team that just needs internal reports. Pricing is custom, embedding projects need product and engineering time, and simpler tools will be faster and cheaper for basic dashboards. If embedded analytics is a selling point for your product, Sisense belongs at the top of the shortlist. If it is not, look elsewhere first.
- Strong embedding for customer-facing analytics
- Good handling of large and varied data
- Flexible APIs and white labeling
- Custom pricing only
- Best value needs developer and product planning
- Overkill for simple internal dashboards
Zoho Analytics is the budget pick that still feels like real BI. Plans start at $24 per month for small teams, rather than per user at enterprise rates, and it connects to Zoho CRM and apps plus common third-party sources. Zia, its AI assistant, can answer questions, explain trends, and flag anomalies in plain language.
Enterprise buyers will notice gaps in governance, security controls, and large-scale deployment compared with Tableau or Looker. Visual design is solid but not best in class. For a small business, a startup, or a team inside Zoho already, Zoho Analytics delivers dashboards, scheduled reports, and self-service exploration at a price that is easy to defend.
- Low-cost plans for small teams
- Good Zoho and third-party connectors
- AI assistant Zia for questions and insights
- Fewer enterprise governance controls
- Visual polish lags Tableau
- Advanced features need higher plans
Metabase is the friendly open source option. Anyone can ask a question by picking tables and filters, without writing SQL, and turn the result into a chart or dashboard. The open source edition is free when you host it yourself, and paid cloud plans start around $500 per month for teams that want hosting and more controls in recent listings, though we list the entry as free here for the self-hosted edition.
Self-hosting is both the advantage and the work. You control data and cost, but you also handle updates, backups, and security. Paid cloud removes that burden at a higher price. For startups, internal teams, and developers who want BI without a long sales cycle, Metabase is one of the quickest credible starts.
- Open source version is free to self-host
- Simple question builder for non-technical users
- Easy dashboards and alerts
- Governance and permissions are lighter than enterprise tools
- Self-hosting needs maintenance
- Advanced modeling is limited
Amazon QuickSight fits teams already running on AWS. It connects naturally to Redshift, S3, Athena, and other AWS services, and its reader pricing can be session-based, which helps when many people view dashboards only occasionally. Embedding into apps and portals is also a core strength, not an afterthought.
Outside AWS, the case weakens. Dashboard design and visual polish do not match Tableau, and session versus user pricing needs modeling for heavy readers who view daily. If your data and apps already live in AWS, QuickSight can be the cheapest and simplest BI layer. If they do not, Power BI or Looker Studio will usually be easier.
- Pay-per-session option for readers
- Strong AWS integration
- Good embedding for apps and portals
- Visual polish trails Tableau
- Pricing model needs care for frequent readers
- Best value inside AWS, less so outside it
How we picked these
We compared official feature pages, pricing pages, documentation, and public reviews, and we kept only platforms that are live and actively sold in October 2026. We weighed dashboard quality, data connections, governance, ease of use for non-technical readers, and total cost including viewer seats. We did not claim hands-on testing, and where pricing is custom or varies by role and capacity, we marked it as See website rather than inventing a single number.
How to choose the right BI platform for your team
Start with where your data lives and who will read the results. A Microsoft shop with Excel and SQL Server will get more from Power BI than from a tool that needs a new data stack. A Google shop with Sheets and BigQuery will move faster with Looker Studio or Looker. A product team that needs analytics inside its app should shortlist Sisense and QuickSight before any general BI tool.
Test with one real dashboard, not a demo dataset
Build a dashboard from your own messy data, with your own metric definitions, and show it to the people who will use it weekly. Check load time, mobile layout, filtering, and how easy it is for a non-analyst to ask a follow-up question. A tool that looks great on sample sales data can struggle on your joins, row counts, and refresh schedule.
Plan for governance early
Decide who defines revenue, churn, or active users, and where that definition lives. Tools with a shared semantic layer, such as Looker, help here, but even lighter tools need one owner for metrics and one review step before a dashboard ships company-wide. Without that, teams will argue about numbers instead of acting on them.
Model the three-year cost
Count builders, analysts, and viewers separately, add capacity or consumption fees, and include implementation time. A cheap per-user price can still be costly if every viewer needs a paid seat or if refresh and storage fees grow with data volume. Get a written quote for your expected user mix before you sign.
Sources
- https://www.microsoft.com/en-us/power-platform/products/power-bi/pricing
- https://www.tableau.com/pricing
- https://lookerstudio.google.com
- https://www.qlik.com/us/products/qlik-sense/pricing
- https://www.thoughtspot.com/pricing
- https://www.domo.com/pricing
- https://www.sisense.com
- https://www.zoho.com/analytics/pricing.html
- https://www.metabase.com/pricing
- https://aws.amazon.com/quicksight/pricing/