Best Data Visualization Tools in 2026: 10 Tools Compared
By ToolNimba Editorial Team October 30, 2026 11 min read

- Top pick
 Tableau
Deep visual analysis at scale
Starting price$75 per user per monthCheck out TableauRead our review - Runner-up
 Microsoft Power BI
Microsoft 365 teams and low cost
Starting priceFreeCheck out Microsoft Power BIRead our review - Also great
 Looker Studio
Free marketing reports
Starting priceFreeCheck out Looker StudioRead our review
How we researched this
We compared official pricing and feature pages, app store listings, privacy policies and public user reviews. Prices change, so check the provider's site before you pay.
Key takeaways
- Tableau and Power BI lead for full business dashboards, while Looker Studio leads for free marketing reports tied to Google data.
- Free and open source tools such as Metabase, Apache Superset, and D3.js can match paid tools on charts, but they need more setup and technical skill.
- Marketers should pick a tool that connects cleanly to their ad, analytics, and spreadsheet sources, because manual exports undo the value of a live dashboard.
- Total cost includes seats, viewers, and setup time, so a cheap per-user price can still become expensive at team scale.
Quick comparison
| Name | Best for | Starting price | Free plan | |
|---|---|---|---|---|
| Tableau | Deep visual analysis at scale | $75 per user per month | Free trial | Visit |
| Microsoft Power BI | Microsoft 365 teams and low cost | Free | Yes | Visit |
| Looker Studio | Free marketing reports | Free | Yes | Visit |
 D3.js | Custom web visuals for developers | Free | Yes | Visit |
 Plotly | Interactive charts in Python and web apps | Free | Yes | Visit |
 Qlik Sense | Guided data exploration | $30 per user per month | Free trial | Visit |
 Sisense | Embedded analytics in products | See website | Free trial | Visit |
 Metabase | Simple self-service dashboards | Free | Yes | Visit |
 Apache Superset | Self-hosted dashboards on SQL data | Free | Yes | Visit |
 Flourish | Animated stories and presentations | Free | Yes | Visit |
The best data visualization tools
The tools below range from drag-and-drop dashboards to code-first chart libraries, so your data skills and your audience should guide the choice.
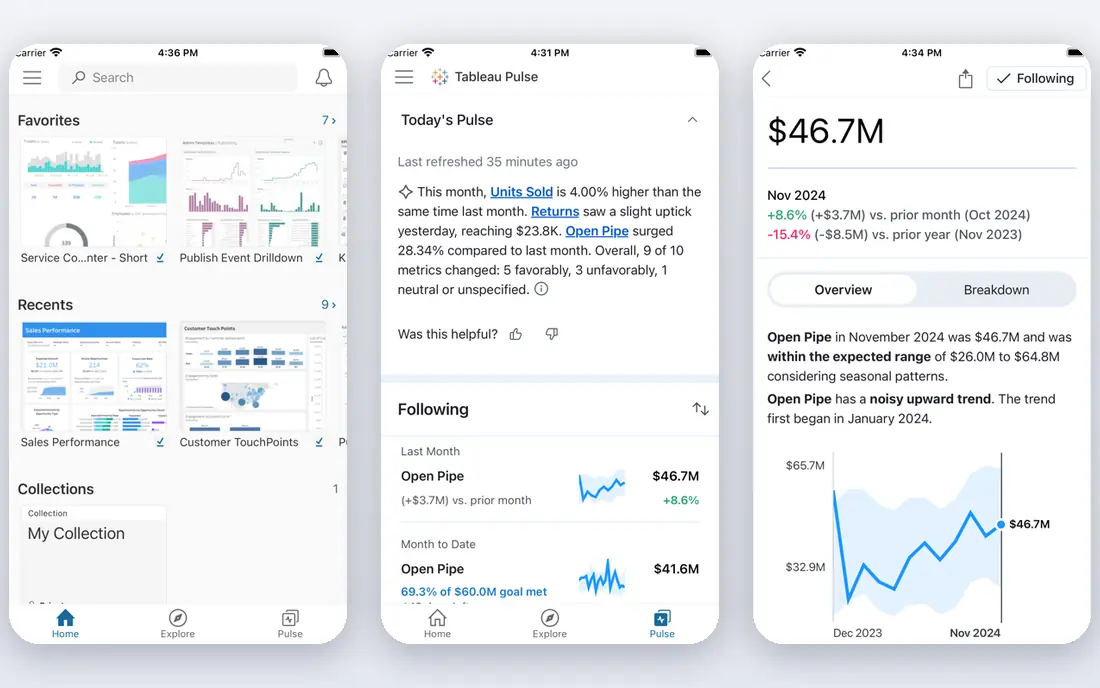
Tableau remains the reference point for visual analysis. Analysts can drag fields onto a canvas, build interactive dashboards, and let viewers filter, drill down, and explore without asking for a new report each time. The range of chart types and the polish of the output suit board presentations as well as day-to-day analysis. Cost is the main barrier. Creator pricing sits well above Power BI and Looker Studio, and viewer and explorer seats add up across a company. Tableau fits teams that analyse data daily, present to senior leaders, and need depth that simpler tools cannot offer. Smaller teams should trial it against Power BI before committing to the higher seat price.
- Strong interactive visuals and exploration
- Wide range of data connectors
- Large community and learning resources
- Higher cost than most rivals
- Advanced features take time to learn well
Power BI is the practical default for many companies, especially those already using Microsoft 365. Power BI Desktop is free to download and build with, and the Pro tier is priced well below Tableau for most teams. Integration with Excel and Teams means reports can live where people already work, rather than in a separate tool they forget to open. The limits appear at scale and at the edges. Sharing reports with people who lack a Pro licence needs care, and data refresh limits on Pro can frustrate teams that need near-live data. Even so, for a Microsoft-centred team that wants solid dashboards without a large licence bill, Power BI is hard to beat.
- Free desktop app for building reports
- Low Pro seat price
- Close integration with Excel, Teams, and Microsoft 365
- Sharing outside a paid setup can be awkward
- Seat costs rise as viewer numbers grow
- Advanced modelling takes practice
Looker Studio, formerly Google Data Studio, is the best free starting point for marketing reports. It connects directly to Google Analytics, Google Ads, Search Console, and Sheets, so a marketer can build a live client or team dashboard without paying for a BI licence. Sharing by link makes it easy to send a report to a client who will never log into your BI system. Looker Studio is not a full BI platform. Data modelling is basic, and complex blends or very large datasets can slow reports down. For marketing teams that mainly report on Google sources and spreadsheets, those limits rarely matter. For finance or operations teams with strict governance needs, a fuller BI tool is a better fit.
- Free for core reporting
- Direct connectors for Google Analytics, Ads, and Sheets
- Easy sharing by link
- Limited data modelling compared with full BI tools
- Performance can suffer on large or complex reports
D3.js is not a dashboard tool. It is a JavaScript library that lets developers build exactly the chart they imagine, from standard bars and lines to maps, networks, and animated stories. Publishers, data journalists, and product teams use it when an off-the-shelf chart looks generic or cannot show the data clearly. That control has a price in skill and time. You write code, handle data loading, and maintain the chart yourself, which rules D3.js out for non-technical teams. For a team with web developers and a need for distinctive, interactive visuals on a site or product, D3.js remains unmatched.
- Free and open source
- Full control over every chart element
- Huge range of custom and interactive visual forms
- Requires JavaScript skill
- No drag-and-drop builder
- Building and maintaining charts takes developer time
Plotly bridges the gap between a chart library and a dashboard platform. Data scientists can build interactive charts in Python, share them in notebooks or web apps, and use Dash to turn analyses into internal tools. The open source libraries are free, which makes Plotly easy to try inside an existing Python workflow. Paid Plotly Cloud and Dash Enterprise plans add hosting, sharing, and app features, so check current pricing if you need those parts. Plotly fits data teams that already work in Python and want interactive output without learning a separate BI product. Teams without Python skills will get faster results from a drag-and-drop tool.
- Free open source chart libraries
- Strong Python support through Dash and Plotly
- Interactive charts that work in browsers and apps
- Full Dash Enterprise apps need a paid plan
- Large datasets can slow browser charts
- Styling takes effort for a polished look
Qlik Sense takes a different approach from most dashboard tools. Its associative engine shows how selections relate to the rest of the data, including values that would be excluded by a normal filter. That helps analysts spot connections they might otherwise miss, and it makes free-form exploration feel more natural than clicking through fixed reports. The downside is complexity in buying and setup. Pricing tiers and enterprise deployment need careful planning, and smaller teams may find the learning curve steeper than Power BI or Looker Studio. Qlik Sense fits mid-size and large teams that explore data deeply and want a governed self-service platform rather than a set of static reports.
- Associative engine that surfaces related data as you filter
- Strong self-service exploration
- AI-assisted insights
- Pricing can be complex across tiers
- Setup and governance take effort at enterprise scale
Sisense is built for a specific job: putting analytics inside a product or portal that customers use. Software companies embed Sisense dashboards so their users can explore usage, sales, or performance data without leaving the app. It also suits internal teams with large data volumes and many sources. Because pricing is quote-based, you cannot compare Sisense on a simple per-user figure, and implementation takes real planning. That makes it a poor pick for a small team that just needs a few internal dashboards. For a product team that needs embedded, white-labelled analytics at scale, Sisense is one of the strongest options on this list.
- Strong embedding for customer-facing analytics
- Handles large and varied data sources
- AI and natural language features
- Quote-based pricing makes budgeting harder
- Implementation needs technical planning
Metabase is the friendliest open source BI tool for small teams. Non-technical users can ask questions through a visual builder, save the results as charts, and pin them to dashboards, while analysts can still write SQL when they need to. The open source version is free and can run on your own server, which appeals to startups and privacy-conscious teams. Governance is lighter than Tableau or Qlik Sense, and some advanced features require a paid plan. For a startup or small team that wants shared dashboards without a large licence bill, Metabase is an excellent starting point. Larger companies with strict access rules should test the paid tiers before rolling it out widely.
- Free open source version
- Question builder lets non-technical users ask questions without SQL
- Easy to self-host or use in the cloud
- Lighter governance than enterprise BI tools
- Advanced modelling and permissions sit in paid tiers
Apache Superset is a powerful open source BI platform for data teams that already work with SQL databases. It connects to many warehouses and databases, offers a wide range of charts, and lets teams build and share dashboards without licence fees. Companies with engineering resources often prefer it to paying per seat for a commercial tool. Setup is the catch. You host it, update it, and support it yourself unless you pay a provider such as Preset. Non-technical users can view and filter dashboards, but building them takes more skill than Metabase or Looker Studio. Superset fits data teams that value control, own their infrastructure, and have the skills to run it.
- Free and open source
- Supports many SQL databases
- Wide chart range with a modern dashboard interface
- Needs technical setup and hosting
- No vendor support without a third-party provider
- Learning curve for non-technical users
Flourish is the storytelling pick on this list. Journalists, marketers, and presenters use it to turn a spreadsheet into an animated bar chart race, an interactive map, or a scrollytelling graphic that holds an audience. The free tier covers many chart types, and embedding makes it easy to publish on a site or in a slide deck. Flourish does not replace a BI tool. It lacks deep data modelling, governed metrics, and live warehouse connections, so it suits finished stories rather than daily operational dashboards. If your goal is to present data clearly to an audience, rather than to explore it internally, Flourish is a fast and attractive choice.
- Free tier for interactive charts and maps
- Animated and storytelling visuals that suit presentations
- Easy embedding and sharing
- Not a full BI platform
- Limited data modelling and live database connections
- Branding limits on the free tier
How we picked these
We compared official feature pages, pricing pages, documentation, and public reviews for tools that are widely used for dashboards, reporting, and custom visuals in 2026. We favoured tools with a clear audience, current development, and honest free or trial terms. We did not claim hands-on testing, and where pricing is quote-based or has changed recently, we list the starting price as See website and point you to the vendor page.
How to choose the right tool
Match the tool to the audience
An executive dashboard needs clarity and trust. A marketing report needs live source connections. A public story needs visual polish. A data team needs flexible modelling. One tool rarely serves all four audiences well, so start with the main reader of your charts.
Count viewers, not just creators
Many tools charge little for the people who build dashboards and much more once viewers, guests, and embedded users are counted. Map out who will view, filter, and share each dashboard before you compare seat prices, and trial the sharing flow with real viewers.
Check your data sources first
List your sources, including spreadsheets, ad platforms, analytics tools, warehouses, and databases. A tool with a native connector for your main source saves hours of manual exports. A tool without one can still work, but only if you accept an extra data pipeline step.
Trial with real data and real questions
Build one dashboard from your own data during a trial, and ask it the questions your team actually asks each week. A demo with sample data hides slow queries, awkward filters, and missing chart types. A trial with real data reveals them in days.