Best BI Tools for Financial Institutions in 2026: 10 Tools Compared
By ToolNimba Editorial Team October 31, 2026 10 min read

- Top pick
 Microsoft Power BI
Microsoft-stack institutions
Starting price$14 per monthCheck out Microsoft Power BIRead our review - Runner-up
 Tableau
Polished visual analysis
Starting price$15 per monthCheck out TableauRead our review - Also great
 Looker
Governed shared metrics
Starting priceSee websiteCheck out LookerRead our review
How we researched this
We compared official pricing and feature pages, app store listings, privacy policies and public user reviews. Prices change, so check the provider's site before you pay.
Key takeaways
- Microsoft Power BI is the most practical starting point for institutions already on Microsoft 365, with strong Excel links and row-level security.
- Tableau suits teams that need polished visual analysis and governed, certified data sources for board and executive reporting.
- Looker fits data-mature firms that need one shared definition for each metric across every report.
- Qlik Sense, SAP Analytics Cloud, and Domo help larger institutions combine planning, reporting, and governed dashboards in one platform.
- Metabase and Sigma offer lower-cost paths for smaller finance teams, provided governance and audit needs are checked early.
Quick comparison
| Name | Best for | Starting price | Free plan | |
|---|---|---|---|---|
| Microsoft Power BI | Microsoft-stack institutions | $14 per month | Free trial | Visit |
| Tableau | Polished visual analysis | $15 per month | Free trial | Visit |
| Looker | Governed shared metrics | See website | No | Visit |
 Qlik Sense | Associative analysis at scale | See website | Free trial | Visit |
 SAP Analytics Cloud | Planning plus BI for SAP users | See website | Free trial | Visit |
 Domo | Cloud dashboards and alerts | See website | Free trial | Visit |
 Sisense | Embedded analytics for products | See website | Free trial | Visit |
 ThoughtSpot | Search-based questions in plain language | See website | Free trial | Visit |
 Metabase | Low-cost self-hosted dashboards | Free | Yes | Visit |
 Sigma | Spreadsheet-style analysis on warehouses | See website | Free trial | Visit |
The best bi tools for financial institutions apps
Banks, insurers, and investment firms need more than charts. They need governed numbers, audit trails, and access controls that satisfy regulators and internal audit. We compared official feature and pricing pages, plus public reviews, to find BI tools that meet those demands without forcing every team into the same workflow.
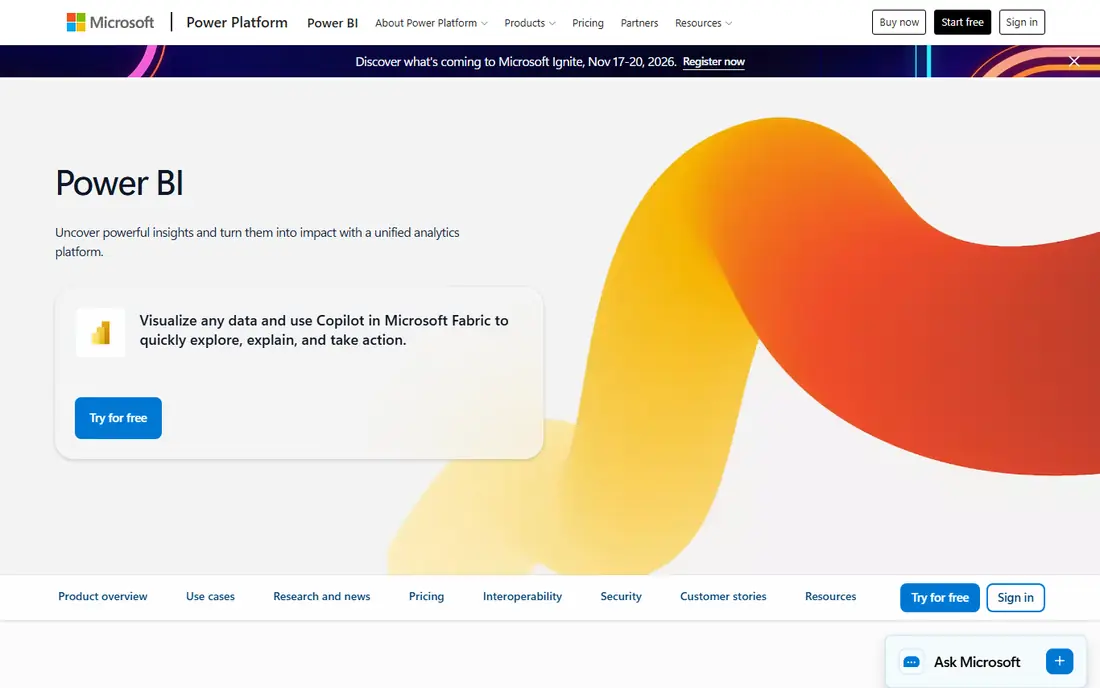
Power BI is the default choice for many financial institutions already running Microsoft 365. It connects to core banking data, loan systems, spreadsheets, and Azure data sources, and it lets analysts build dashboards with DAX formulas for complex financial calculations. Row-level security helps each branch, team, or role see only the data it should see.
Pricing is listed from $14 per user per month for Power BI Pro, with Premium Per User at a higher tier for larger datasets and more frequent refresh. Institutions that need enterprise governance, larger models, and dedicated capacity should budget for Premium. For mid-size firms on Microsoft tools, Power BI offers the best balance of price, familiarity, and control.
- Deep Excel and Microsoft 365 links
- Row-level security
- Large connector library
- Governance at scale needs Premium capacity
- Advanced AI features need higher licensing
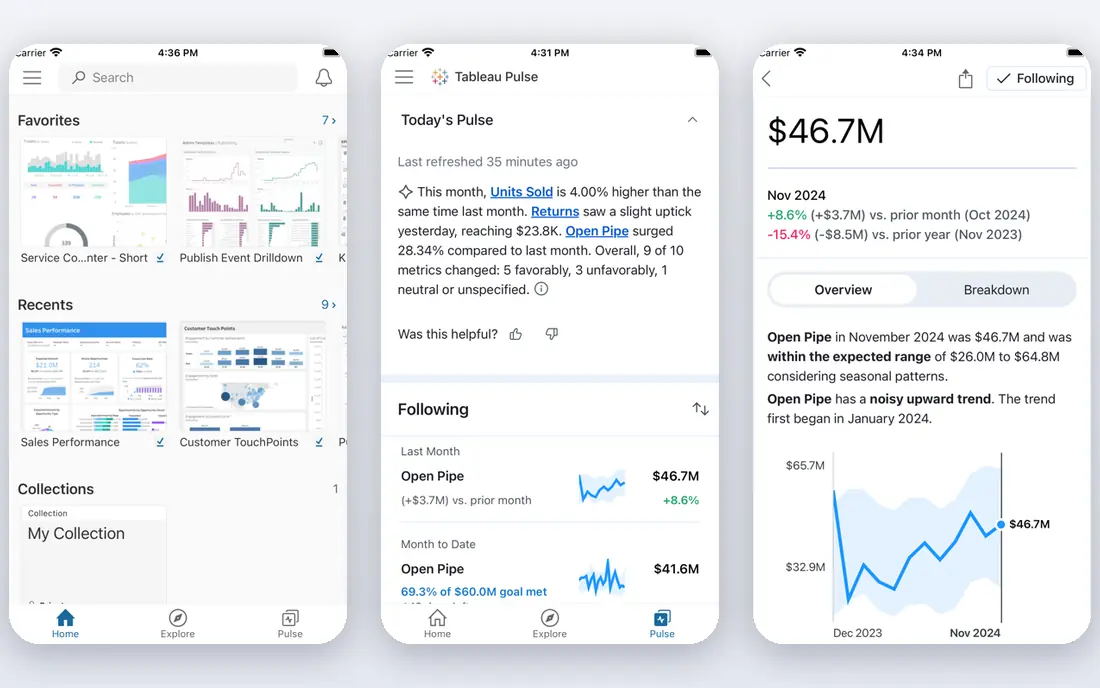
Tableau is known for visual analysis that helps finance teams spot patterns in risk, lending, and portfolio data. Analysts can drag fields onto a canvas, filter by segment, and build dashboards that executives can read without a data background. Certified data sources let a central team publish trusted datasets that others reuse, which helps keep reported numbers consistent.
Tableau pricing varies by role, with Viewer, Explorer, and Creator tiers listed on the vendor site. Creator seats cost more, so plan who needs to build versus who only needs to view. For institutions where presentation quality and deep exploration matter, Tableau remains a strong, if pricier, option.
- Strong visual exploration
- Certified data sources for governance
- Wide data connections
- Creator pricing is higher than Power BI
- Full deployment needs planning for governance
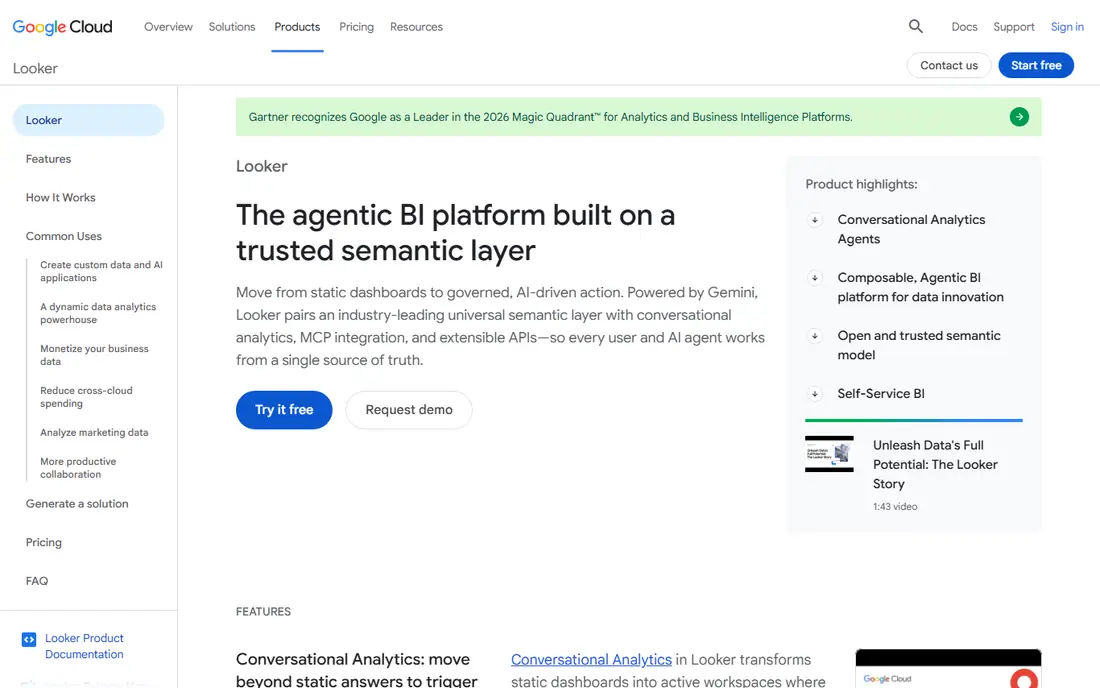
Looker, part of Google Cloud, is built around a semantic layer called LookML. Analysts define metrics once, such as net interest margin or loan loss provision, and every dashboard uses that same definition. That consistency is vital for financial reporting, where two teams reporting different versions of the same metric can cause real problems.
The trade-off is entry cost and skill. Looker pricing is custom, and published reviews note a high minimum commitment for larger deployments. It also needs a team comfortable modelling data in a warehouse. For data-mature banks and fintechs on Google Cloud, Looker offers governance that looser dashboard tools cannot match.
- LookML semantic layer gives one metric definition
- Strong Google Cloud links
- Governed exploration
- Pricing is custom and can be high
- Needs data maturity and modelling skill
Qlik Sense uses an associative engine that lets users click through linked data and see how selections affect every chart at once. For a bank exploring loan performance by region, product, and risk band, that freedom helps analysts follow a question without rebuilding a report each time. Qlik also offers governance, lineage, and access controls suited to regulated firms.
Pricing is custom and tiered by user type, so request a quote based on builders versus viewers. Qlik suits institutions that want self-service exploration with central control, rather than a purely static reporting tool.
- Associative engine for exploring linked data
- Strong governance and audit features
- AI-assisted insights
- Pricing is custom
- Learning curve for advanced modelling
SAP Analytics Cloud combines dashboards, planning, and predictive features in one cloud platform. For financial institutions running SAP for finance and risk, it connects directly to those systems and supports budgeting, forecasting, and variance reporting alongside standard BI. That combination reduces the need to move planning data between separate tools.
Pricing is custom and based on users and capacity. Smaller firms without SAP may find Power BI or Tableau simpler and cheaper. For SAP-centric banks and insurers, SAP Analytics Cloud keeps finance data, plans, and reports in a governed whole.
- Combines BI, planning, and forecasting
- Deep SAP data links
- Enterprise governance
- Best value only for SAP-heavy firms
- Pricing and setup are enterprise-grade
Domo is a cloud BI platform that pulls data from many sources into live dashboards, with alerts when a metric crosses a threshold. For treasury, risk, and operations teams, that alerting helps surface liquidity, fraud, or service issues quickly. Domo also supports data preparation and sharing within a governed workspace.
Pricing is custom, so institutions should clarify data volume, user counts, and any embedded use before signing. Domo fits firms that want a single cloud hub for dashboards and alerts, rather than a desktop-heavy analysis tool.
- Large connector library
- Alerts and automated reporting
- Cloud-native collaboration
- Pricing is custom
- Costs can rise with data volume and users
Sisense is often chosen when a financial firm wants analytics inside its own product or portal, such as client reporting or advisor dashboards. It handles large datasets, supports custom visualisations, and lets developers embed dashboards with access controls. That embedded strength also works for internal teams that need tailored reporting.
Sisense pricing is custom, and deployments benefit from data engineering help for modelling and performance. For firms that mainly need internal dashboards, Power BI or Tableau may be simpler. For firms that sell analytics as part of a service, Sisense is worth shortlisting.
- Strong embedded analytics
- Handles large and complex datasets
- Customisable dashboards
- Pricing is custom
- Implementation needs data engineering support
ThoughtSpot lets business users type a question, such as loan approvals by region last quarter, and get a chart and answer without writing SQL. That search style helps CFOs, risk managers, and branch leaders explore data without waiting for an analyst. AI features can summarise changes and highlight drivers behind a metric shift.
The catch is data modelling. ThoughtSpot works best when a central team has defined clean, governed models first. Pricing is custom, so scope users and data sources early. For institutions that want wider self-service without giving every user a full BI builder, ThoughtSpot is a strong option.
- Ask questions in plain language
- AI summaries and spotlights
- Governed data models
- Pricing is custom
- Best results need well-modelled data
Metabase is the low-cost entry point for smaller financial firms, credit unions, and fintech startups. The open source version can be self-hosted for free, and the visual question builder lets non-technical users build dashboards without SQL. Technical users can write SQL directly when they need precise control.
Governance is lighter than Power BI, Tableau, or Looker. There is no full semantic layer in the free tier, and large datasets need tuning. For a small team that needs clear dashboards on a tight budget, Metabase is practical. For a regulated bank with strict audit needs, check the paid Pro or Enterprise tiers and their governance features first.
- Free open source tier
- Fast to first dashboard
- SQL and visual question builder
- Governance and semantic layer are thinner than enterprise tools
- Performance needs care on large datasets
Sigma gives finance teams a spreadsheet-like interface on top of a cloud data warehouse, such as Snowflake or BigQuery. Analysts can use familiar formulas, pivot data, and build dashboards without exporting to Excel and losing the link to source data. Write-back features support planning and forecasting workflows that pure dashboard tools handle less well.
Sigma needs a warehouse in place, so it fits firms that already centralise data there. Pricing is custom, based on users and usage. For FP and A teams that model in spreadsheets but want live, governed data, Sigma bridges the gap between Excel and enterprise BI.
- Excel-style formulas on live warehouse data
- Write-back for planning
- Governed metrics
- Needs a cloud warehouse
- Pricing is custom
How we picked these
We compared official feature and pricing pages for BI platforms used by financial institutions, plus public reviews focused on governance, security, and finance use cases. We favoured tools with row-level security or equivalent access controls, audit or lineage features, and connectors for core banking, ERP, and warehouse data. We left out general chart tools without governance features and niche products that could not be verified as still supported.
What financial institutions should check first
Governance and audit
Ask how metrics are defined, who can change them, and whether changes are logged. A shared semantic layer, certified datasets, or governed models help prevent conflicting reports. Check for audit logs, data lineage, and SSO support before you commit, since regulators and internal audit will ask for them.
Security and access control
Row-level security, role-based access, and encryption in transit and at rest are baseline needs for financial data. Confirm how the tool handles sensitive fields, whether data can be masked, and where data is hosted. For cloud tools, check the vendor's compliance reports and data residency options.
Data sources and refresh
List your core systems, such as core banking, loan origination, ERP, and CRM, and confirm native connectors or warehouse support for each. Check refresh frequency and latency for the reports that matter most, such as daily risk, liquidity, and lending dashboards. A tool that refreshes weekly will not serve a trading or treasury desk.
Cost at full deployment
Many BI prices quote a single user tier, but total cost includes builders, viewers, Premium capacity, and data volume. Model the cost for all users who will view dashboards, not just analysts who build them. Compare that total across two or three shortlisted tools before signing.
Sources
- https://www.microsoft.com/en-us/power-platform/products/power-bi/pricing
- https://www.tableau.com/pricing
- https://cloud.google.com/looker/pricing
- https://www.qlik.com/us/products/qlik-sense
- https://www.sap.com/products/technology-platform/cloud-analytics.html
- https://www.domo.com/platform
- https://www.sisense.com/platform/
- https://www.thoughtspot.com/platform
- https://www.metabase.com/pricing/
- https://www.sigmacomputing.com/pricing/