Best KPI Software in 2026: 9 Tools Compared
By ToolNimba Editorial Team October 31, 2026 10 min read

- Top pick
 Databox
Marketing and sales KPI dashboards
Starting price$89 per monthCheck out DataboxRead our review - Runner-up
 Klipfolio
Custom client and team dashboards
Starting price$140 per monthCheck out KlipfolioRead our review - Also great
 Geckoboard
TV and wallboard KPI displays
Starting price$99 per monthCheck out GeckoboardRead our review
How we researched this
We compared official pricing and feature pages, app store listings, privacy policies and public user reviews. Prices change, so check the provider's site before you pay.
Key takeaways
- Databox and Geckoboard are built for visible, always-on KPI dashboards, while Power BI and Tableau suit deeper analysis.
- Looker Studio is the strongest free starting point if most of your data already lives in Google tools.
- Per-user pricing can look cheap until many viewers need access, so check viewer and editor limits before you buy.
- The best KPI tool is the one your team actually opens each week, not the one with the longest integration list.
- Start with five to ten metrics that drive decisions, then add more only when a metric changes what someone does.
Quick comparison
| Name | Best for | Starting price | Free plan | |
|---|---|---|---|---|
| Databox | Marketing and sales KPI dashboards | $89 per month | Yes | Visit |
| Klipfolio | Custom client and team dashboards | $140 per month | Free trial | Visit |
| Geckoboard | TV and wallboard KPI displays | $99 per month | Free trial | Visit |
 Microsoft Power BI | Microsoft 365 teams and data modelling | $14 per user per month | Yes | Visit |
 Tableau | Deep visual analysis | $75 per user per month | Free trial | Visit |
 Zoho Analytics | Small teams already using Zoho | $30 per month | Yes | Visit |
 Looker Studio | Free Google-based reporting | Free | Yes | Visit |
 Domo | Large teams unifying many sources | See website | Free trial | Visit |
 SimpleKPI | Simple KPI tracking without BI complexity | See website | Free trial | Visit |
The best KPI software
KPI software turns scattered numbers into a shared view of how a business is doing. Some tools focus on simple dashboards and alerts, while others are full business intelligence platforms. We compared official pricing pages, free plans, integration lists and dashboard features to find options for small teams, agencies and larger companies.
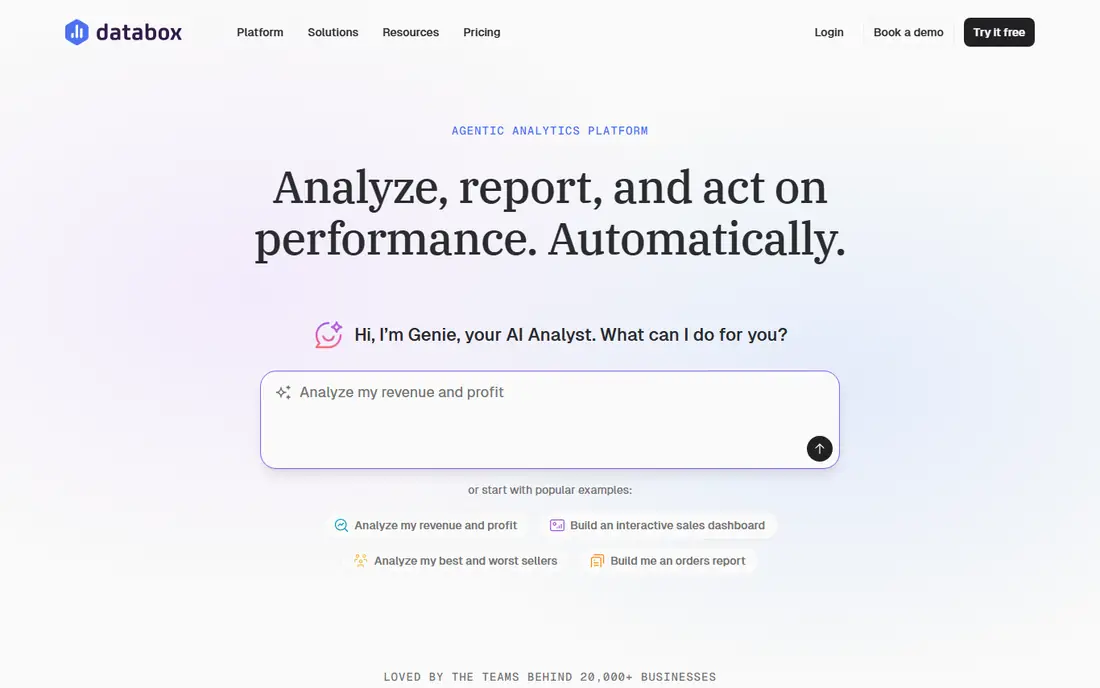
Databox is built for teams that want a KPI dashboard up fast without hiring an analyst. It connects to common marketing, sales and finance tools, offers ready-made metrics and lets you set goals, alerts and scheduled scorecards. That combination suits agencies and marketing teams that report the same numbers every week and need clients or managers to see progress at a glance.
The cost is the main watch point. The free plan covers a small number of sources and one dashboard, and paid plans are priced by users and sources rather than by viewers alone. If you only track a handful of metrics, Databox is easy to justify. If you need heavy modelling or a warehouse, a full BI tool may fit better.
- Many prebuilt metrics and templates
- Goal tracking and alerts
- Scorecards for teams and clients
- Paid plans rise quickly with users and data sources
- Deep data modelling is limited
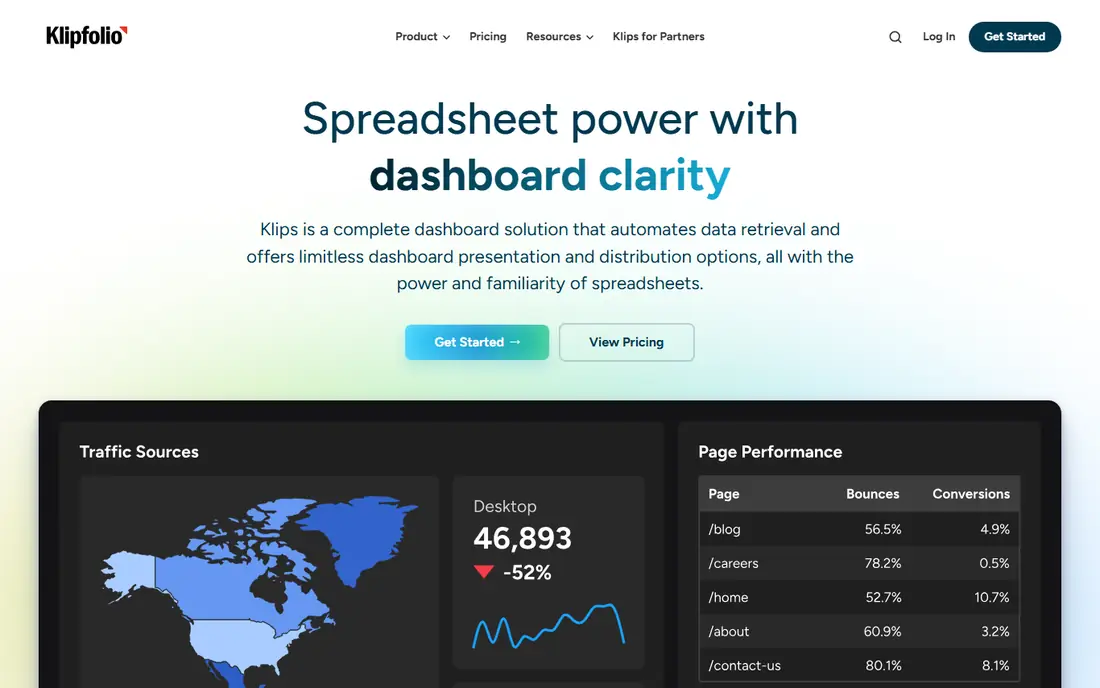
Klipfolio gives dashboard builders a lot of control. Its widget system, called Klips, lets you shape charts, tables and metrics with formulas and custom layouts, which is useful for agencies that need a distinct look for each client. Scheduled reports and sharing options help teams send the same dashboard to clients without manual screenshots.
That control comes with effort. Klipfolio is not the fastest tool for a first dashboard, and teams without a confident builder may find the setup slow. It earns its place for companies that value precise, branded dashboards and are willing to invest time in building them well.
- Fine control over dashboard design
- Formula-based metrics
- Scheduled reports for clients
- Building dashboards takes more time and skill
- Pricing is high for very small teams
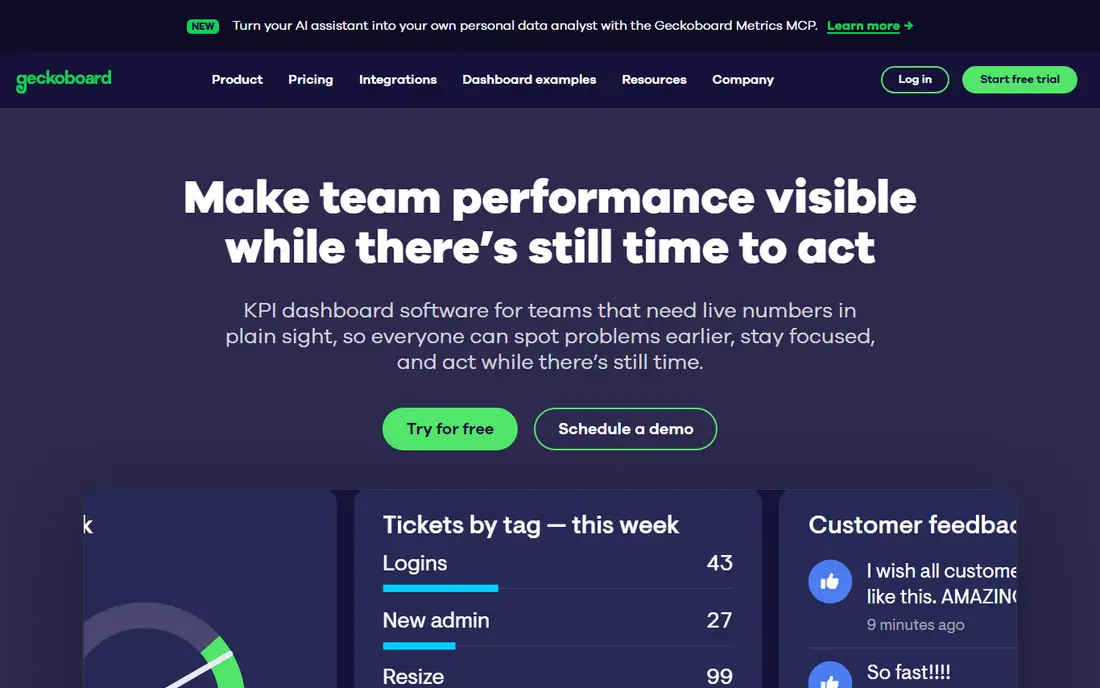
Geckoboard does one job very well: it puts live KPIs where a whole team can see them. Sales, support and operations teams use it on wallboards to show targets, ticket queues, revenue and other numbers that change through the day. Setup is simpler than a full BI platform, and the display mode is built for glanceable numbers rather than dense reports.
It is not a replacement for analysis. If your team needs to slice data, build models or explore why a number moved, you will still need another tool. Geckoboard is our pick when visibility is the goal and the dashboard needs to be understood from across the room.
- Designed for shared screens and office TVs
- Live updates
- Simple dashboard setup
- Less suited to deep analysis
- No permanent free plan
Power BI is the natural KPI choice for companies already on Microsoft 365. It connects well to Excel, SharePoint, Teams and Azure data, and its modelling tools let analysts clean data, define measures and build interactive reports. The free desktop version is useful for building and testing reports before you pay to share them widely.
Sharing is where costs add up, because viewers often need a paid licence too. Power BI also rewards teams that invest in data modelling skills. For a Microsoft-centred company with an analyst or a data-savvy manager, it offers far more depth per dollar than a simple dashboard tool.
- Strong data modelling with Power Query
- Deep Microsoft 365 and Teams integration
- Free desktop app for building reports
- Sharing needs paid licences for viewers in many cases
- Learning curve for modelling is real
Tableau is known for visual exploration. Analysts can drag fields into charts, filter on the fly and build dashboards that invite questions, not just display totals. That makes it a strong fit for data-driven teams that want to dig into trends, compare segments and test ideas without waiting for a new report each time.
The trade-off is price and setup. Per-user pricing adds up for large viewer groups, and a governed Tableau rollout takes planning around data sources, permissions and publishing. Small teams may find it more than they need, but for analysis-led companies, Tableau remains a benchmark for visual depth.
- Rich interactive visuals
- Strong exploration and filtering
- A large community and template base
- Higher per-user cost
- Full deployment needs more setup and governance
Zoho Analytics is a practical middle ground. It offers dashboards, reports and data blending at a lower entry price than most enterprise BI tools, and it works smoothly with Zoho CRM, Books and other Zoho products. The free plan, with a small number of users and rows, lets a tiny team test real dashboards before paying.
Its limits show up in very large or complex setups. Connector depth and advanced modelling do not match Power BI or Tableau, and row limits matter for growing data sets. For a small business already in the Zoho world, though, it is hard to beat on value.
- Good value for small teams
- Connects to Zoho CRM and other Zoho apps
- AI-assisted insights on higher plans
- Fewer third-party connectors than larger BI tools
- Advanced modelling is less deep
Looker Studio, formerly Data Studio, is the best free KPI starting point for Google-centred teams. You can build dashboards from Google Analytics, Google Ads, Sheets and BigQuery, share them by link and schedule email delivery without paying a licence fee. For a startup, freelancer or small marketing team, that is often enough.
Free does not mean unlimited. Large dashboards can load slowly, and you get less control over permissions, support and enterprise governance than with a paid platform. Still, if your data is mostly in Google tools and your budget is tight, start here and move to a paid tool only when you hit a clear limit.
- Free to use
- Strong Google Analytics, Ads and Sheets connectors
- Easy sharing by link
- Performance can suffer on large data
- Governance and support are lighter than paid BI tools
Domo is an all-in-one platform that brings data in, cleans it, models it and shows it in dashboards and mobile apps. That breadth suits larger companies that want one platform for many departments, with governance, alerts and embedded views. Its mobile experience is also stronger than many desktop-first BI tools.
The catch is cost and scope. Pricing is by quote, and Domo is aimed at mid-market and enterprise budgets, not at a five-person team tracking ten metrics. If your company already has many sources and a data team, Domo is worth a demo. If not, a simpler dashboard tool will be faster and cheaper.
- End-to-end data ingestion, transformation and dashboards
- Mobile access
- Strong enterprise controls
- Quote-based pricing puts it out of reach for many small teams
- Implementation takes planning
SimpleKPI takes a different approach. Instead of pulling every metric from connected apps, it lets teams enter KPIs, set targets, assign owners and track progress in clear charts. That suits small operations, charities and teams whose key numbers come from spreadsheets, manual counts or systems without an easy connector.
Automation is the limit. If you need live data from dozens of apps, Databox or a BI tool will save more time. SimpleKPI wins when the main problem is discipline and visibility: a small set of numbers, clear owners and a regular review rhythm.
- Focused on KPI entry, targets and charts
- Easy for non-technical users
- Manual data entry is supported
- Fewer automated integrations than dashboard platforms
- Less suited to large, automated data pipelines
How we picked these
We compared official pricing and feature pages, free plans, connector lists and dashboard design for KPI use, not general reporting alone. We favoured tools that let a team define targets, view trends and share results, and we kept a mix of free, mid-priced and enterprise options. Prices change, so check the vendor pricing page for your user count and billing term before you commit.
How to choose the right KPI tool
Start with decisions, not dashboards
List the decisions your team makes each week, then pick the metrics that change those decisions. Revenue, pipeline, churn, support backlog and delivery time are common starting points. A dashboard with 40 metrics that no one acts on is worse than a dashboard with eight metrics that drive a weekly meeting.
Count viewers, not just builders
Some tools charge per editor and let many people view for free, while others charge per viewer too. Map out who builds, who edits and who only views, then price that real group. Also check data source limits, refresh rates and mobile access, because a dashboard that only works on a desktop will not get used by field or sales teams.
Test with real data for two weeks
Build one dashboard with your live data, share it with the people who will use it and watch whether they open it. Check how long updates take, whether alerts are useful and whether anyone asks for a metric you missed. That short trial tells you more than a feature list ever will.
Sources
- https://databox.com
- https://klipfolio.com
- https://www.geckoboard.com
- https://powerbi.microsoft.com
- https://www.tableau.com
- https://www.zoho.com/analytics
- https://lookerstudio.google.com
- https://www.domo.com
- https://www.simplekpi.com
- https://www.basedash.com/blog/best-dashboard-software-for-small-businesses-compared-2026
- https://databox.com/10-best-klipfolio-alternatives-in-2026