Best Observability Tools in 2026: 9 Platforms Compared
By ToolNimba Editorial Team October 31, 2026 9 min read

- Top pick
 Datadog
All-in-one cloud observability
Starting price$15 per host per monthCheck out DatadogRead our review - Runner-up
 New Relic
Usage-based full-stack observability
Starting priceFreeCheck out New RelicRead our review - Also great
 Grafana Cloud
Open-source stack users and dashboards
Starting price$19 per monthCheck out Grafana CloudRead our review
How we researched this
We compared official pricing and feature pages, app store listings, privacy policies and public user reviews. Prices change, so check the provider's site before you pay.
Key takeaways
- Datadog leads on breadth, New Relic leads on a free start, and Grafana Cloud leads for open-source stack teams.
- Honeycomb is the specialist pick for trace-first debugging, while Sentry is the fastest path to error visibility for developers.
- Billing units matter more than headline prices, since per-host, per-GB, and per-series charges grow in different ways as you scale.
Quick comparison
| Name | Best for | Starting price | Free plan | |
|---|---|---|---|---|
| Datadog | All-in-one cloud observability | $15 per host per month | Free trial | Visit |
| New Relic | Usage-based full-stack observability | Free | Yes | Visit |
| Grafana Cloud | Open-source stack users and dashboards | $19 per month | Yes | Visit |
 Dynatrace | Enterprise automatic root-cause analysis | See website | Free trial | Visit |
 Honeycomb | Trace-first debugging of complex systems | $150 per month | Yes | Visit |
 Sentry | Error tracking plus application monitoring | $26 per month | Yes | Visit |
 Elastic Observability | Search-led logs and APM | See website | Yes | Visit |
 Splunk Observability Cloud | Splunk portfolio enterprises | See website | Free trial | Visit |
 SigNoz | OpenTelemetry-native open-source observability | $49 per month | Yes | Visit |
The best observability tools
Observability means seeing metrics, logs, and traces together well enough to find why a system slowed down or failed. This list covers full platforms, open-source stacks, and specialist debuggers, so you can match the tool to your stack, team size, and budget. For startups, start small and watch cardinality, since high-cardinality labels are a common cause of surprise bills.
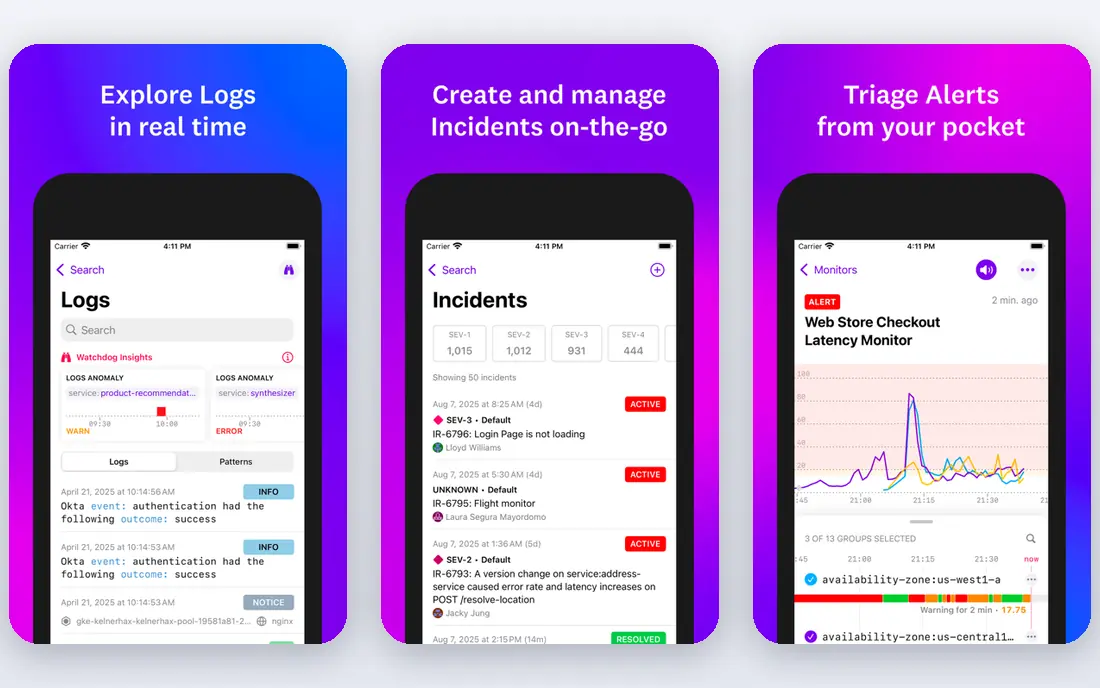
Datadog fits cloud-native teams that want infrastructure, application, log, and security monitoring from one vendor. Its integration catalog covers common cloud services, containers, and databases, so teams can correlate a slow request with host and log data in one place. That breadth reduces tool sprawl, which helps on-call teams during incidents. The catch is billing, since per-host charges plus data ingest can rise quickly, so set retention and cardinality limits early. Check the export or sharing step early, because a tool that feels fast while you edit can still add friction at delivery.
- Broad integrations
- Metrics, logs, traces, and security in one platform
- Strong dashboards
- Per-host and per-GB pricing can grow fast
- Setup needs planning
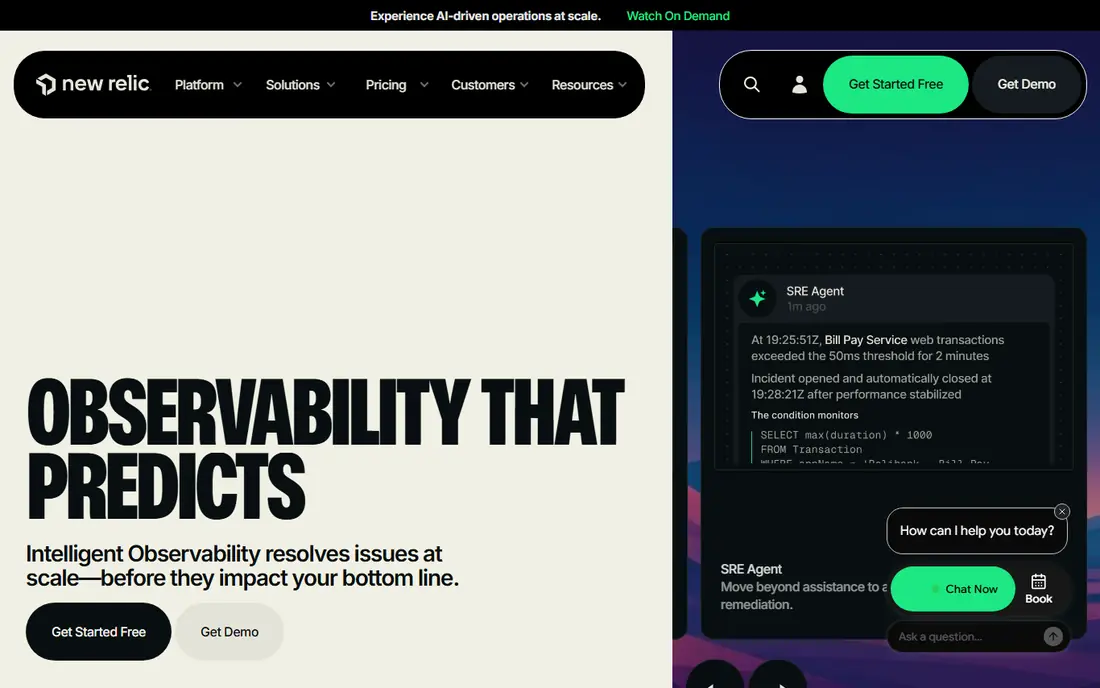
New Relic fits teams that want a full platform without per-host locks, starting from a genuinely useful free tier. Its 100 GB of free monthly ingest lets small teams monitor real services before paying, with APM, logs, and infrastructure in one view. Usage-based pricing suits teams with uneven traffic, since you pay for data rather than a fixed host count. The catch is seat pricing, because adding full users across a larger team changes the bill. Try the free tier or trial on a small job first, and note what is locked behind a paid plan before you build a workflow around it.
- 100 GB free monthly ingest
- Full-stack coverage
- Usage-based pricing
- Per-user seats add cost
- Data beyond free ingest is charged by volume
Grafana Cloud fits teams already invested in Prometheus, Grafana dashboards, and OpenTelemetry. It manages the open-source stack at scale, so teams keep familiar dashboards and query languages without running every backend themselves. Flexibility is the draw, since you can mix metrics, logs, and traces and build views around your services. The catch is usage pricing, because active series and log volume sit on top of the platform fee. Before you commit, test it on one real project with your usual files and export settings, so you can see where it slows down before it matters.
- Managed Prometheus, Loki, and Tempo stack
- Flexible dashboards
- Strong community
- Usage charges on top of base fee
- Assembly still needs expertise
Dynatrace fits large enterprises with complex, hard-to-map environments where manual dashboard building falls behind. Its automatic discovery maps services and dependencies, and its analysis tools point toward likely root causes during incidents. For teams managing hundreds of services, that automation saves real investigation time. The catch is scale and cost, since smaller teams may find the platform and contract heavier than they need. Check the export or sharing step early, because a tool that feels fast while you edit can still add friction at delivery.
- Automatic discovery and topology
- AI-assisted root-cause analysis
- Broad coverage
- Enterprise pricing
- Platform can feel heavy for small teams
Honeycomb fits engineering teams debugging distributed systems where a problem hides in one unusual combination of attributes. Its trace-first approach lets you slice events by user, service, or request detail and follow a single request across services. That high-cardinality querying is powerful when standard dashboards show only averages. The catch is entry price, since the paid plan starts higher than many general monitors, so it suits teams with real debugging pain. Try the free tier or trial on a small job first, and note what is locked behind a paid plan before you build a workflow around it.
- High-cardinality event debugging
- Fast trace queries
- Strong for distributed systems
- Entry price is high for small teams
- Less of a general infrastructure monitor
Sentry fits developer-led teams whose first question during an incident is which error, in which release, affected which users. It groups errors, shows stack traces and context, and links problems to code changes and releases. Setup is quick, and alerts stay close to the code teams actually change. The catch is scope, since infrastructure and network monitoring need a companion tool for full coverage. Before you commit, test it on one real project with your usual files and export settings, so you can see where it slows down before it matters.
- Fast error grouping and alerts
- Code-level context
- Easy developer setup
- Less full-stack infrastructure depth than Datadog or Dynatrace
Elastic Observability fits log-heavy teams already comfortable with the Elastic Stack or needing deep search across large log volumes. Its search tools make it practical to query, filter, and visualize logs at scale, with APM and infrastructure views alongside. Self-hosting gives control over data and costs for teams with the skills to run it. The catch is operations, since Elasticsearch tuning and upgrades are real work, even on managed plans. Check the export or sharing step early, because a tool that feels fast while you edit can still add friction at delivery.
- Powerful log search on Elasticsearch
- Flexible self-host or cloud options
- Running Elasticsearch well needs expertise
- Pricing varies by deployment
Splunk Observability Cloud
Best for: Splunk portfolio enterprises
Splunk Observability Cloud fits enterprises already using Splunk, where streaming analytics and existing data pipelines matter. It covers infrastructure, applications, and user experience with real-time views, and integrates with the wider Splunk portfolio. For Splunk shops, shared skills and data flows reduce the learning curve. The catch is cost structure, since per-host tiers plus log ingest need careful budgeting at scale. Try the free tier or trial on a small job first, and note what is locked behind a paid plan before you build a workflow around it.
- Streaming real-time analytics
- Strong for Splunk users
- Broad signal coverage
- Per-host pricing at scale
- Best value inside a Splunk estate
SigNoz fits teams that want an OpenTelemetry-native platform without vendor lock-in, with a free self-hosted option. It collects metrics, logs, and traces in one interface, using OpenTelemetry as the standard instrumentation path. That openness matters for teams that want to move data between tools later. The catch is maturity and ecosystem size, since some integrations and enterprise features lag the largest vendors. Before you commit, test it on one real project with your usual files and export settings, so you can see where it slows down before it matters.
- OpenTelemetry-native design
- Self-host free
- Metrics, logs, and traces in one UI
- Smaller ecosystem than Datadog
- Self-hosting needs operations effort
How we picked these
We compared official feature pages, current pricing pages, app store listings, privacy policies where they mattered, and public reviews. We kept only products that exist and work today, and that fit the topic directly rather than loosely. Where a price was unclear or changed by plan, we used See website instead of guessing, and we treated free tiers as useful only when they cover real work, not just a demo. We also weighed the honest trade-offs. A strong feature set means less when the price, the learning curve, or the export options make everyday use harder. That is why each write-up below names a catch alongside the strengths, so you can match the tool to your budget, skill level, and the kind of output you actually need.
How to choose an observability platform
Instrument with OpenTelemetry first
OpenTelemetry gives you portable instrumentation that works across most platforms on this list. Treat that instrumentation as the durable asset, and the platform as a choice you can revisit later.
Model your real bill, not the headline price
Estimate hosts, log volume, metric series, and users, then check retention and cardinality. A platform that looks cheap at ten hosts can become expensive at one hundred, or when a new label multiplies your series.
Test an incident, not just a dashboard
During a trial, recreate a real slow request or failed deploy and time how long it takes to find the cause. The best observability platform is the one that shortens that investigation, not the one with the prettiest charts.