Alternatives to Power BI in 2026: 9 Tools Compared
By ToolNimba Editorial Team November 2, 2026 11 min read

- Top pick
 Tableau
Visual exploration
Starting price$15 per user per monthCheck out TableauRead our review - Runner-up
 Looker
Governed metrics
Starting priceSee websiteCheck out LookerRead our review - Also great
 Qlik Sense
Associative exploration
Starting price$300 per monthCheck out Qlik SenseRead our review
How we researched this
We compared official pricing and feature pages, app store listings, privacy policies and public user reviews. Prices change, so check the provider's site before you pay.
Key takeaways
- Tableau is our pick for visual exploration, while Looker is best for governed metrics on Google Cloud.
- Metabase and Apache Superset are the best free and open source alternatives, if your team can self-host.
- Looker Studio is the best free cloud pick for Google users who need simple, shareable dashboards.
- Zoho Analytics is the best budget pick for small teams, with real BI features at a low monthly price.
- ThoughtSpot suits non-technical users who want to ask questions in plain language, rather than build dashboards by hand.
Quick comparison
| Name | Best for | Starting price | Free plan | |
|---|---|---|---|---|
| Tableau | Visual exploration | $15 per user per month | No | Visit |
| Looker | Governed metrics | See website | No | Visit |
| Qlik Sense | Associative exploration | $300 per month | No | Visit |
 ThoughtSpot | Search-driven analytics | $25 per user per month | No | Visit |
 Metabase | Open source BI | Free | Yes | Visit |
 Apache Superset | Open source dashboards | Free | Yes | Visit |
 Zoho Analytics | Budget small teams | $24 per month | Yes | Visit |
 Looker Studio | Free Google dashboards | Free | Yes | Visit |
 Domo | BI plus data integration | See website | No | Visit |
The best alternatives to power bi
Power BI is strong, especially inside Microsoft 365, but it is not the right fit for every team. Some teams need better visuals, some need a governed metric layer, and some need a lower price or an open source option. These nine cover those reasons to switch, without listing Power BI itself as a pick.
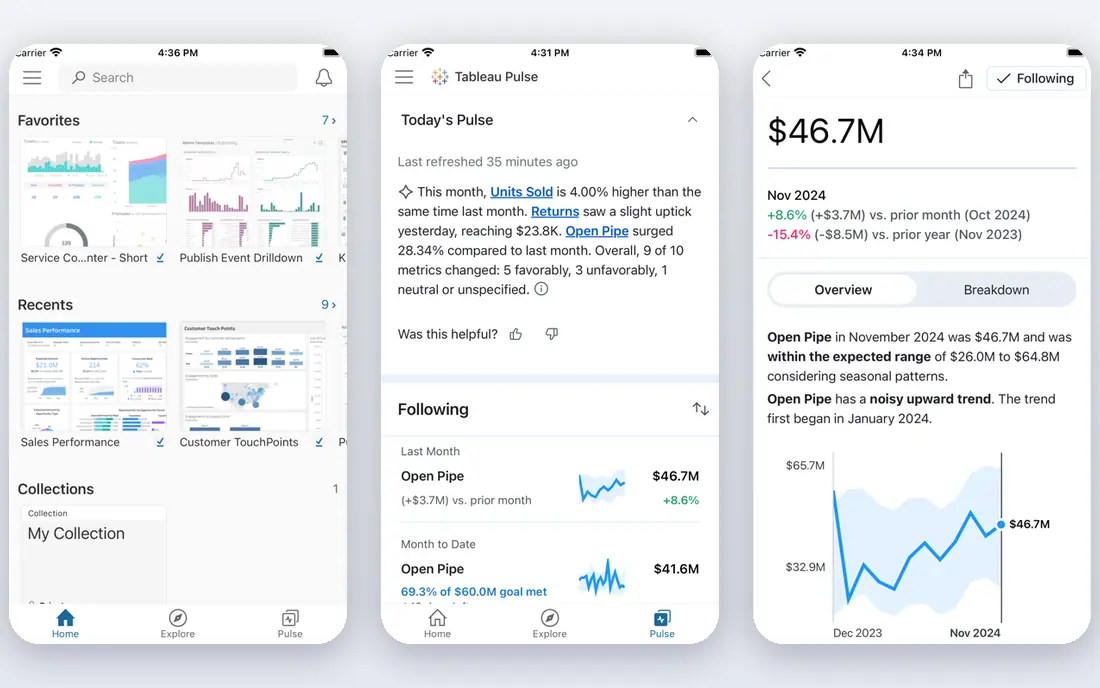
Tableau remains the visual leader in BI, and it is the most common switch for teams that find Power BI visuals limiting. Interactive dashboards, maps, and custom charts are easier to build and explore here, and analysts can drill into data without rebuilding a report for every question. Viewer pricing starts at $15 per user per month in recent tables, while Creator pricing for authors is $75 per user per month, so the mix of roles matters.
That role pricing is the main drawback. A team with many authors will pay far more than a team with mostly viewers, and advanced features and governance tools can add further cost. Tableau also needs more analyst skill than a simple dashboard tool, so non-technical users may still need help building their first dashboards.
We pick Tableau when visual discovery is the job: exploring sales patterns, customer segments, or operational trends where a chart leads to the next question. If your team mainly needs scheduled reports at low cost, Metabase or Zoho Analytics will be cheaper.
- Best-in-class visual analytics
- Strong interactive dashboards
- Wide data connector library
- Creator pricing is high
- Costs rise fast with many creators
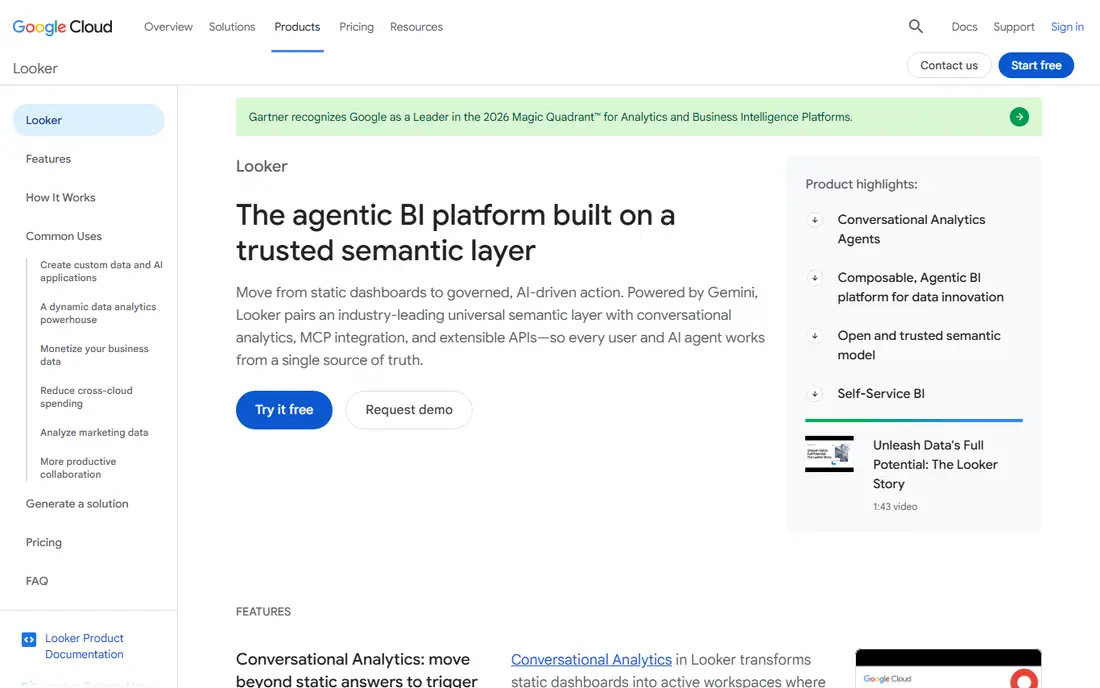
Looker, now part of Google Cloud, is the pick for teams that need one definition of revenue, churn, or active users across every dashboard. Its LookML modeling layer defines metrics once, so different teams cannot build conflicting versions of the same number. That governance is why larger companies choose Looker even when a simpler tool would be cheaper.
The cost is complexity and price. Looker is quote-based, so you need a sales conversation to get a firm figure, and you need data modeling skill to build and maintain the semantic layer. Small teams without a data engineer may find Looker heavy for simple reporting, and the learning curve is steeper than Looker Studio or Metabase.
Choose Looker when metric consistency, governance, and embedded analytics matter more than low entry cost. If you only need a few Google dashboards, Looker Studio gives you a free starting point, and you can move to Looker when governance becomes a real problem.
- LookML semantic layer for consistent metrics
- Strong governance and embedded analytics
- Deep Google Cloud fit
- Quote-based pricing
- Needs modeling skill to get full value
Qlik Sense uses an associative engine that shows how selections relate across the whole dataset, not just in one chart. When you filter to a product, a region, or a time period, Qlik highlights related and unrelated values, which helps analysts spot patterns they did not think to query. That exploration style suits power users who ask follow-up questions all day.
Pricing starts at $300 per month for a 10-user starter configuration in recent tables, which is high for a very small team but reasonable for a mid-market team that uses the tool daily. The interface and scripting concepts take time to learn, so new users should expect training before they build complex apps.
We recommend Qlik Sense for teams that do heavy ad hoc analysis and want to explore freely, rather than read fixed reports. If your users mainly view scheduled dashboards, a simpler or cheaper tool will serve them better.
- Associative engine reveals related data
- Strong ad hoc exploration
- Mature enterprise governance
- Higher entry price for small teams
- Interface takes learning for new users
ThoughtSpot lets users type a question, such as sales by region last quarter, and get a chart and answer without building a dashboard. That search model suits executives and managers who want an answer now, not a report next week. Entry pricing is listed at $25 per user per month billed yearly in recent comparisons, with a free trial available.
The catch is data preparation. ThoughtSpot works best on clean, well-modeled data, so a messy warehouse will give confusing answers no matter how good the search interface is. Per-user pricing also scales linearly, so a large viewer base can cost more than a tool with cheaper viewer seats.
Pick ThoughtSpot when your bottleneck is self-service for non-technical users, and you have data owners who can maintain models. If your team is mostly analysts who build dashboards, Tableau or Qlik Sense may give more control for the same budget.
- Ask questions in plain language
- Search-driven answers for non-technical users
- AI agent features for exploration
- Needs clean, governed data models to work well
- Per-user costs scale with adoption
Metabase is the most approachable open source alternative to Power BI. You can self-host it for free, connect to SQL databases, ask questions with a visual builder or SQL, and share dashboards with your team. That low barrier makes it popular with startups and technical teams that want control without a large license bill.
Cloud hosting starts at a paid monthly price in recent tables, with higher plans adding SSO, row-level permissions, and other enterprise features. Self-hosting is free in license terms, but you still pay for a server, backups, and maintenance time, so the true cost is not zero for a production setup.
We like Metabase for SQL-savvy teams that need solid dashboards fast, and for companies that want to avoid vendor lock-in. If your users need deep visual design or a governed semantic layer, Tableau or Looker will be stronger, but for everyday reporting Metabase is hard to beat on value.
- Free self-hosted open source version
- Easy for SQL-savvy teams
- Simple dashboards and questions
- Cloud hosting costs extra
- Advanced governance needs higher plans
Apache Superset is a free, open source BI platform built for technical teams. It offers a large chart library, a SQL Lab for analysts, and dashboards that can handle many data sources, all without a license fee. For data teams that already run their own infrastructure, Superset gives a flexible, extensible alternative to paid BI tools.
Setup is the trade-off. You need to host, secure, and maintain Superset yourself, or pay a managed provider such as Preset, which offers hosted Superset plans. Non-technical users may find the interface less guided than Metabase or Zoho Analytics, so analyst support matters for adoption.
Choose Superset when your team is technical, your data stack is complex, and you want open source control at scale. For a small non-technical team that needs a hosted tool with support, Metabase Cloud or Zoho Analytics will be easier to run.
- Free and open source
- Wide chart library
- SQL Lab for analysts
- Scales for technical teams
- Needs technical setup and hosting
- Less polished for non-technical users
Zoho Analytics is the budget pick that still feels like real BI, not just a chart toy. Plans start at $24 per month for 2 users in recent tables, with higher plans adding users and rows, and a free plan for very small use. You get dashboards, scheduled reports, AI-assisted questions, and connectors to many common sources, plus a smooth fit if you already use Zoho CRM or other Zoho apps.
Visual depth is the limit. Zoho will not match Tableau for complex, custom visual exploration, and large data volumes may need a higher plan. For a small team that needs clear KPI dashboards, sales reports, and marketing views without an enterprise budget, those limits rarely matter.
We recommend Zoho Analytics for small businesses, agencies, and nonprofits that need BI on a small budget. It is also a good first BI tool: easy to learn, cheap to start, and capable enough that many teams never need to upgrade to a pricier platform.
- Low price for real BI features
- Easy for non-technical users
- Good Zoho ecosystem fit
- Less powerful than Tableau for complex visuals
- Row limits vary by plan
Looker Studio, formerly Google Data Studio, is the best free cloud alternative for Google users. You can build dashboards from Google Analytics, Google Ads, Sheets, and BigQuery, share them like a Google Doc, and give viewers free read access. That sharing model is a major advantage over tools that charge for every viewer.
The limits are governance and modeling. Looker Studio does not offer the same semantic layer as Looker, so metric definitions can drift across reports if teams are not careful. Complex data modeling, row-level security at scale, and enterprise controls need Looker or another enterprise tool, and Looker Studio Pro adds paid features for larger deployments.
Pick Looker Studio when your data lives in Google tools, your dashboards are straightforward, and cost is the main constraint. It is also a good companion tool: use it for marketing and web reports, even if you use another BI tool for finance or operations.
- Free for standard features
- Easy sharing like a Google Doc
- Native Google Analytics and Ads connectors
- Less governance than Looker
- Limited for complex modeling
- Pro features cost extra
Domo combines data integration, preparation, and BI in one cloud platform, which suits teams that want fewer tools to manage. With many connectors and built-in ETL features, you can pull data from apps, clean it, and build dashboards without a separate pipeline tool for many common cases. That all-in-one approach helps mid-market teams that move fast and need executive dashboards quickly.
Pricing is quote-based, so small teams cannot judge cost from a public price list, and Domo is generally positioned above budget tools such as Zoho Analytics. The breadth of features can also feel complex for a team that only needs simple reports.
Choose Domo when you need BI plus integration in one place, and when you have the budget for an enterprise-style platform. If you only need dashboards and already have a warehouse, Tableau, Looker, or Metabase may be a more focused and cheaper choice.
- Built-in data integration plus BI
- Many connectors
- Good for executive and operational dashboards
- Quote-based pricing
- Can be costly for small teams
How we picked these
We compared official pricing pages and recent 2026 BI comparisons, and we favored tools that are actively maintained, available today, and cover visual, governed, search-driven, open source, and budget needs. We did not claim hands-on testing of each tool on the same dataset. Instead, we weighed visualization quality, modeling and governance, ease of use for non-technical users, viewer pricing, self-hosting options, and total cost beyond the headline seat price. That total cost view matters, because viewer seats, warehouse compute, and implementation time can change the ranking.
How to switch from Power BI
Start by listing the Power BI reports people actually use, because audits often show that many legacy dashboards are rarely opened. Migrate only the reports that drive decisions, and rebuild them in the new tool rather than copying every visual exactly. Use the migration to clean metric definitions, remove stale data sources, and set ownership for each dashboard.
Run the old and new tools in parallel for one reporting cycle, and compare numbers side by side before you turn Power BI off. That check catches modeling differences early, when they are easy to fix. Train users on the new workflow, especially if you move to a search-driven tool such as ThoughtSpot or a visual tool such as Tableau, because a tool switch fails more often from low adoption than from missing features.
Sources
- https://www.tableau.com
- https://cloud.google.com/looker
- https://www.qlik.com
- https://www.thoughtspot.com
- https://www.metabase.com
- https://superset.apache.org
- https://www.zoho.com/analytics/
- https://lookerstudio.google.com
- https://www.domo.com
- https://www.blazesql.com/blog/power-bi-alternatives
- https://www.basedash.com/blog/bi-tool-pricing-plans-seat-limits-and-ai-costs-2026