Best Orderflow Trading Platform in 2026: 9 Platforms Compared
By ToolNimba Editorial Team November 10, 2026 11 min read

- Top pick
 ATAS
Footprint and volume profile in one place
Starting price$85 per monthCheck out ATASRead our review - Runner-up
 Bookmap
Live order book heatmaps
Starting price$16 per monthCheck out BookmapRead our review - Also great
 Sierra Chart
Value and stability
Starting price$26 per monthCheck out Sierra ChartRead our review
How we researched this
We compared official pricing and feature pages, app store listings, privacy policies and public user reviews. Prices change, so check the provider's site before you pay.
Key takeaways
- ATAS is our pick for most order flow traders, because it combines footprint charts, volume profile, heatmaps, and replay in one workspace.
- Bookmap is the specialist choice for watching live liquidity, thanks to its order book heatmap, while Sierra Chart is the value pick for traders who can handle a dense interface.
- NinjaTrader is the best starting point if you want order flow tools plus a free platform tier and a large indicator ecosystem.
- Data feed costs sit on top of platform prices, so compare the full monthly total, not just the subscription headline.
- This is not financial advice; trading carries risk, and order flow tools show market activity without guaranteeing any outcome.
Quick comparison
| Name | Best for | Starting price | Free plan | |
|---|---|---|---|---|
| ATAS | Footprint and volume profile in one place | $85 per month | Free trial | Visit |
| Bookmap | Live order book heatmaps | $16 per month | Free trial | Visit |
| Sierra Chart | Value and stability | $26 per month | Free trial | Visit |
 Quantower | Modern interface across brokers | $70 per month | Free trial | Visit |
 NinjaTrader | Free start and automation | Free | Yes | Visit |
 Jigsaw Trading | Depth of market specialists | See website | Free trial | Visit |
 TradingLite | Crypto order flow in the browser | See website | Free trial | Visit |
 GoCharting | Browser-based footprint charts | See website | Yes | Visit |
 DeepCharts | Browser-based futures order flow | Free | Yes | Visit |
The best orderflow trading platforms
Order flow trading means looking past the candle to the trades and resting orders behind it. Footprint charts show how much volume traded at each price, split between buyers and sellers. Volume profile shows where volume built up over a session. A depth of market view shows orders waiting to trade. The platforms below all handle at least one of those jobs well, and the best ones handle several.
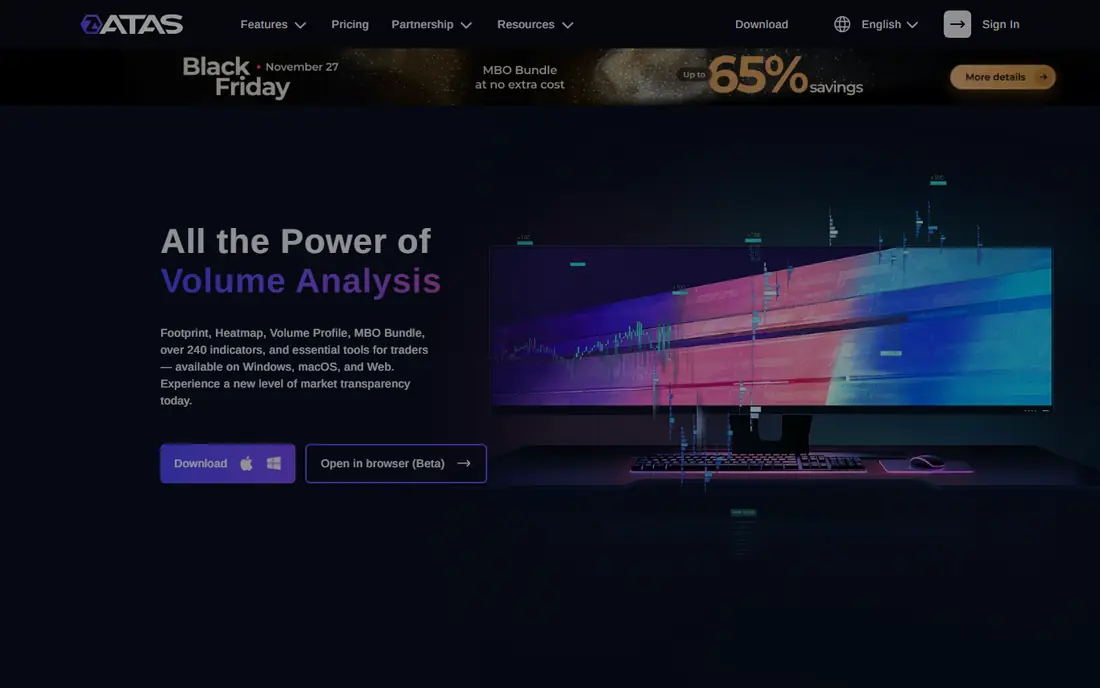
ATAS is built around volume analysis, and that focus shows in its charting. Its footprint charts offer many cluster variations, so you can view bid versus ask volume, delta, or plain volume at each price level inside a single bar. Volume profile, market profile, and heatmap tools sit in the same workspace, which means you are not switching apps to check a second view of the same session.
The platform also supports replay, which matters more than most beginners expect. Replaying a session lets you practice reading imbalances and absorption without risking money, and ATAS connects to many futures, stock, and crypto venues. The honest catch is the learning curve: there are many settings to learn, and the monthly price plus a data feed adds up. For traders who already know they want order flow as their main lens, though, ATAS is the most complete single purchase here.
- Deep footprint and cluster chart options
- Volume profile and heatmaps included
- Replay for practice
- Learning curve for new traders
- Windows-focused history, though web and Mac versions now exist
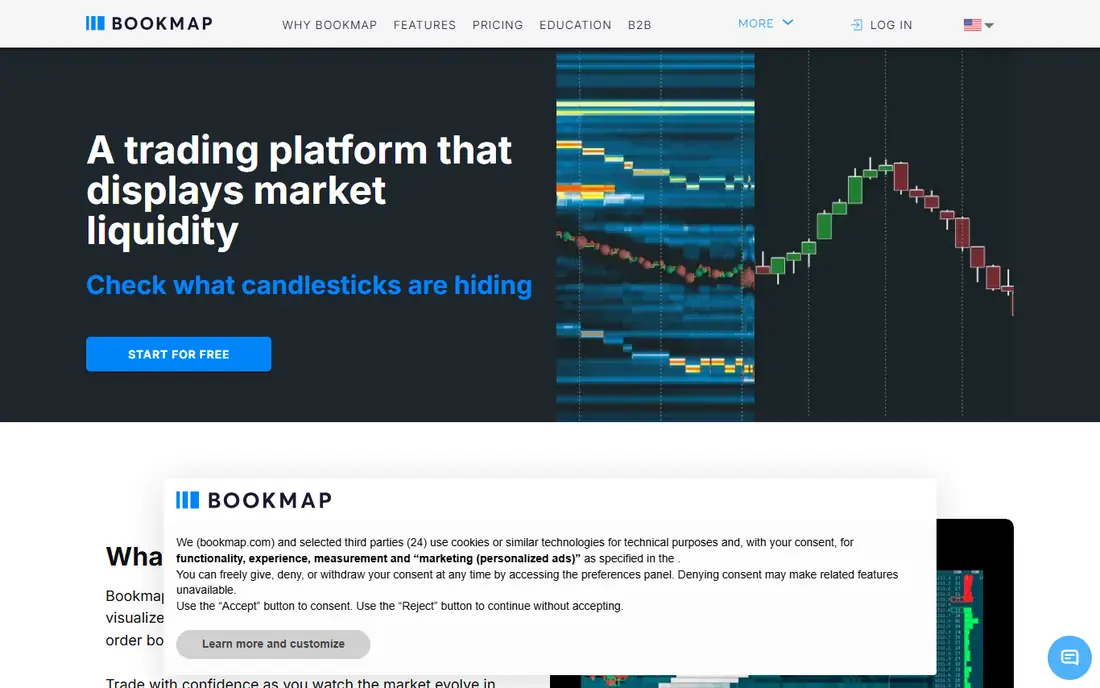
Bookmap does one job better than anyone else on this list: it shows the order book as a heatmap over time, so you can see liquidity appear, sit, and vanish as price moves. That view helps traders spot large resting orders, spoofing-like behavior, and areas where price has repeatedly reacted. It is a different skill from reading footprints, and many professionals run Bookmap next to a footprint platform for that reason.
Bookmap is not trying to be your only charting app. It has charts and trading features, but traders who want deep indicator libraries or complex automation often pair it with another platform. The entry tier is cheap, which makes it easy to try, but the fuller feature set sits on higher tiers. If your main question is where liquidity sits right now, start here.
- Clear heatmap of resting liquidity over time
- Strong for futures
- Many data feed options
- Not a full charting platform on its own
- Higher tiers cost more
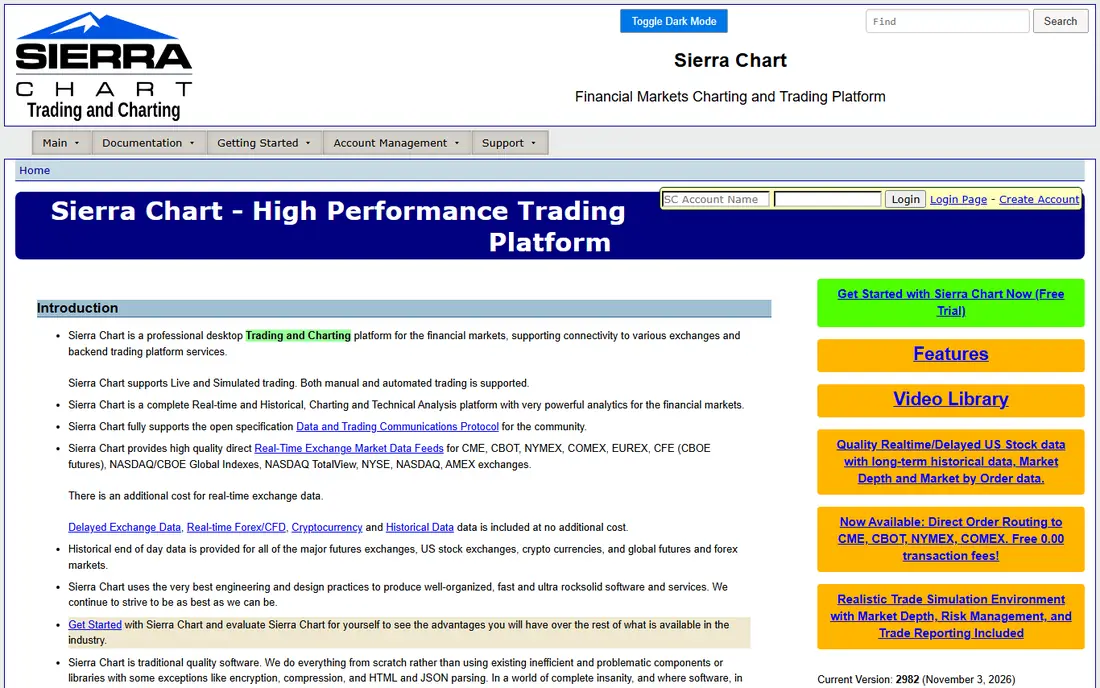
Sierra Chart has a reputation for speed and stability that long-time futures traders trust. It handles footprint-style numbers bars, volume profile, market profile, and market replay, and it can work with unfiltered historical data from supported feeds. For traders who run many charts at once, its low resource use is a real advantage, and the monthly price is among the lowest here.
The interface is the price you pay for that value. It looks dated, menus run deep, and new users often need tutorials before the workspace feels natural. Broker and data setup also takes more care than on a modern web app. If you are willing to learn it, Sierra Chart gives you professional-grade order flow tools for a modest subscription. If you want polish first, Quantower or ATAS will feel friendlier.
- Fast and stable
- Huge study library
- Low monthly cost
- Dated and dense interface
- Setup takes patience
Quantower feels like a modern trading app, with a clean workspace, flexible panels, and support for many brokers and data providers. That broker flexibility matters, because you can often keep your existing broker relationship instead of switching to fit the platform. Its footprint charts, volume profile, DOM, and replay cover the core order flow workflow in one place.
Compared with ATAS, Quantower is slightly less deep on footprint customization, and traders who live inside cluster charts may notice the difference. It is also worth checking which features your broker connection includes, since some setups are free through participating brokers while others need a paid plan. For traders who want a modern look without giving up order flow tools, Quantower is a strong middle ground.
- Clean modern design
- Works with many brokers and feeds
- Footprint and DOM tools included
- Footprint depth is a step behind ATAS
- Some features need add-ons
NinjaTrader is the easiest low-risk entry point on this list. The platform itself has a free tier for charting and analysis, and its ecosystem includes many third-party indicators, including order flow and footprint add-ons. It also supports strategy automation and market replay, so you can test ideas and practice sessions in the same app you trade from.
Order flow purists sometimes argue that NinjaTrader is less precise than ATAS or Sierra Chart for tick-level work, and that is worth knowing if footprint accuracy is your whole edge. For most developing traders, though, the free start, the documentation, and the breadth of the platform outweigh that concern. Just remember that a live data feed for futures exchanges is a separate cost on top of the platform.
- Free platform tier
- Large indicator and strategy ecosystem
- Replay and automation
- Tick-level precision concerns raised by some advanced users
- Data feed costs still apply
Jigsaw Trading is built by and for depth of market traders. Its DOM tools show bid and ask activity, iceberg behavior, and absorption in a way that generic charting apps do not, and its education material explains the auction concepts behind those views. Traders who trade mainly from the DOM, rather than from candles, often find Jigsaw the clearest tool for the job.
The focus is also the limitation. Jigsaw is not a general charting platform with hundreds of indicators, and its learning curve is steep for anyone new to order flow. Pricing has historically included a one-time purchase option, so check the current site for the latest terms before budgeting. If the DOM is your primary screen, Jigsaw deserves a trial. If you want footprint charts as your main view, ATAS fits better.
- Purpose-built DOM tools
- Auction and imbalance concepts taught well
- Focused design
- Steep learning curve
- Narrower scope than full charting platforms
TradingLite brings order flow tools to crypto traders in the browser. It offers heatmaps, footprint-style views, and market data across crypto exchanges, without requiring a desktop install. That browser access is handy for traders who move between machines or who want a quick liquidity check without opening a heavy platform.
The crypto focus is both the strength and the limit. Futures and stock traders will find less here than on ATAS or Sierra Chart, and the most useful features sit behind a paid plan. For crypto traders who want to see liquidation levels, order book depth, and trade flow in one web app, TradingLite is one of the few tools built for exactly that market.
- Browser-based crypto order flow
- Heatmaps and footprint views
- No install needed
- Crypto focused, so futures traders gain less
- Advanced features need a paid plan
GoCharting is a browser-based charting platform with footprint charts, volume profile, and market profile tools. That makes it useful for traders who want order flow views without installing software, or who trade from more than one computer. The free tier lets you try the core charts before paying, which is a fair way to judge whether the footprint rendering suits you.
Desktop specialists still go deeper on customization, replay, and data handling, and GoCharting is best seen as a practical browser alternative rather than a replacement for ATAS at the top end. For newer traders, students of order flow, or anyone who values access from any browser, it is a sensible place to start learning footprint reading.
- Runs in the browser
- Footprint and volume profile tools
- Free tier to start
- Less depth than desktop specialists
- Data coverage varies by market
DeepCharts is a newer browser-based platform focused on futures order flow. It offers footprint charts, volume profile, and DOM analysis without a desktop install, and it has a free mode with delayed data for learning the tools. Some prop firms also offer access through evaluations, which can remove the subscription cost for traders already in those programs.
Because it is younger, DeepCharts trails the established platforms on custom scripting and third-party indicators, and its asset coverage is narrower than a general platform. For a futures trader who wants a clean browser workflow and mainly needs footprint and DOM views, it is worth a trial. For traders who need deep customization, ATAS or Sierra Chart remain safer bets.
- Browser-based futures order flow
- Footprint, volume profile, and DOM views
- Free mode available
- Younger platform with a smaller indicator ecosystem
- Limited asset coverage
How we picked these
We compared official feature pages, pricing pages, and public reviews, and we kept only platforms with genuine order flow features such as footprint charts, volume profile, DOM views, or order book heatmaps. General charting apps without those tools did not make the list. We also mixed desktop specialists, browser tools, and a free starting option, so traders at different stages can find a realistic first step.
What to check before you pay
Start with your market and your data feed. A platform that shines for CME futures may be weak for crypto, and a cheap subscription can become expensive once exchange data fees are added. Confirm that your broker or data provider is supported, and ask what the feed costs per exchange before you commit. A trial that uses delayed or sample data will not tell you how the platform handles a fast live session.
Replay, speed, and screen layout
Replay is the feature we would test first in any trial. Can you replay a session at full speed, pause on a footprint bar, and review what happened at each price level? Next, check performance with several charts open during a busy market period, since footprint and heatmap tools process every trade and book update. Finally, build the exact layout you would trade from, because a tool that looks good in a demo can feel cramped with a DOM, a footprint chart, and a volume profile open at once.
A realistic way to learn order flow
Order flow tools reward patience. Start with one concept, such as delta or absorption, and watch it across many sessions in replay before adding a second concept. Keep position sizes small while you learn, and keep a log of what the tool showed versus what price did next. That record will tell you faster than any forum whether a particular view is actually helping your decisions.
Sources
Frequently asked questions
What is order flow trading?
Order flow trading means studying the actual trades and resting orders behind price moves, using tools such as footprint charts, volume profile, and depth of market views. Instead of only seeing that price rose, you can see how much volume traded at each price and whether buyers or sellers were more aggressive there.
Do I need an order flow platform to trade futures?
No. Many traders do well with standard charts and good risk management. Order flow tools help traders who want extra detail on participation and liquidity, but they add complexity and cost, and they do not remove trading risk.
Which platform is best for footprint charts?
ATAS is our pick for footprint depth, with many cluster chart options and replay in the same workspace. Sierra Chart and Quantower also offer footprint-style charts, and GoCharting and DeepCharts provide browser-based options for traders who prefer not to install software.
How much do data feeds cost on top of the platform?
Data feed costs vary by exchange and by whether you trade live or only study delayed data. Budget for exchange fees per market on top of the platform subscription, and confirm the total with your broker or data provider before subscribing.
Can I learn order flow for free?
Yes, up to a point. NinjaTrader, GoCharting, and DeepCharts all offer free tiers or free modes, and replay with delayed data can teach the basics. Live data and the full feature sets of the specialist platforms usually require a paid plan.
Is order flow trading risky?
Yes. All trading carries risk, and order flow analysis does not guarantee profits. This article is general information, not financial advice, and you should only trade with money you can afford to lose.