Best Reporting Tools in 2026: 9 Tools Compared
By ToolNimba Editorial Team November 9, 2026 10 min read

- Top pick
 Microsoft Power BI
Microsoft-stack business reporting
Starting price$14 per user per monthCheck out Microsoft Power BIRead our review - Runner-up
 Tableau
Visual analysis and dashboards
Starting price$15 per user per monthCheck out TableauRead our review - Also great
 Looker Studio
Free Google reporting
Starting priceFreeCheck out Looker StudioRead our review
How we researched this
We compared official pricing and feature pages, app store listings, privacy policies and public user reviews. Prices change, so check the provider's site before you pay.
Key takeaways
- The best reporting tool depends on where your data already lives, since Microsoft, Google and Zoho users get the smoothest start in their own ecosystems.
- Power BI is the strongest all-round pick for most business teams, while Tableau leads for visual depth and Looker Studio leads for free reporting.
- Free and low-cost tools such as Looker Studio, Metabase and Zoho Analytics can cover many small-team needs without an enterprise budget.
- Governance matters as much as charts, so check metric definitions, permissions and data refresh before you commit to a platform.
Quick comparison
| Name | Best for | Starting price | Free plan | |
|---|---|---|---|---|
| Microsoft Power BI | Microsoft-stack business reporting | $14 per user per month | Yes | Visit |
| Tableau | Visual analysis and dashboards | $15 per user per month | Free trial | Visit |
| Looker Studio | Free Google reporting | Free | Yes | Visit |
 Zoho Analytics | Small business reporting | Free | Yes | Visit |
 Domo | Enterprise dashboards and data apps | See website | No | Visit |
 Qlik Sense | Exploratory data analysis | See website | Free trial | Visit |
 ThoughtSpot | Search-driven reporting | $25 per user per month | Free trial | Visit |
 Metabase | Open-source team reporting | Free | Yes | Visit |
 Klipfolio | Marketing and agency dashboards | See website | Free trial | Visit |
The best reporting tools
Reporting tools turn data from spreadsheets, databases, CRMs and other apps into dashboards, charts and scheduled reports that managers can actually use. We compared official pricing pages, product pages and public documentation, and we focused on data connections, dashboard quality, sharing, governance and cost. The tools below range from free starters to enterprise platforms, so the right pick depends on team size, data maturity and budget.
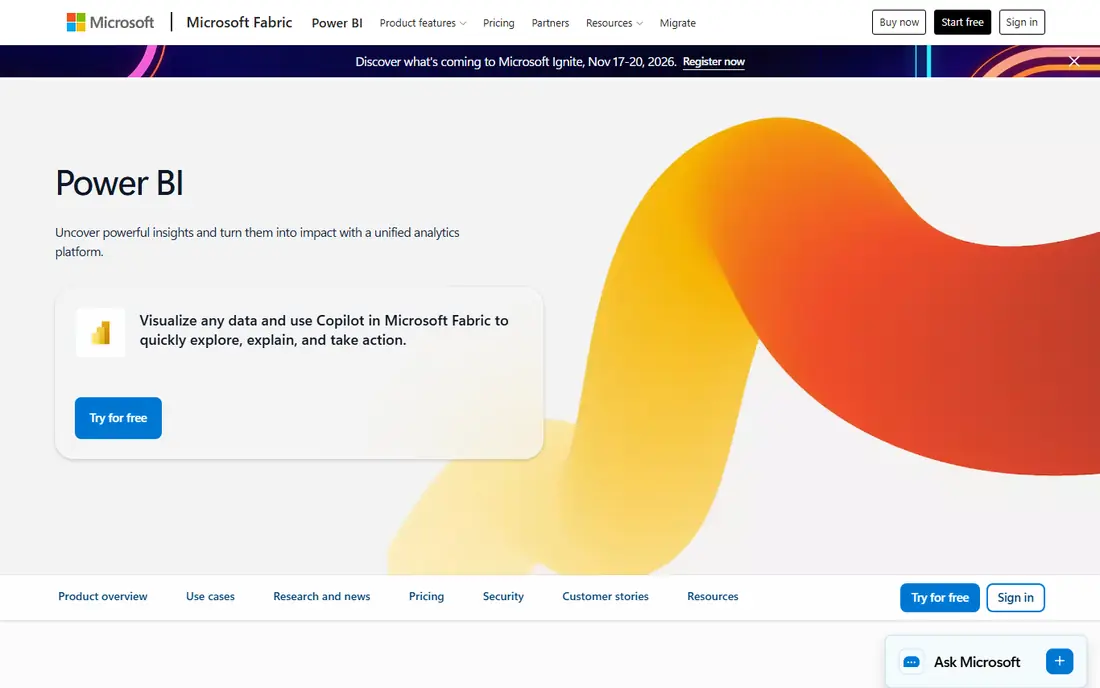
Power BI is our pick for most business teams, especially those already using Microsoft 365, Excel and Teams. Power BI Desktop is free for building reports, and Pro, at $14 per user per month in recent listings, enables sharing and collaboration. Connections cover spreadsheets, databases, cloud apps and Microsoft services, and dashboards update on a schedule managers can rely on.
The learning curve appears when you move beyond simple charts into data modelling with DAX, Microsoft's formula language for Power BI. That depth is also a strength, since it lets analysts build consistent measures rather than one-off spreadsheet calculations. For a team that lives in Microsoft tools, Power BI gives enterprise reporting at a mid-market price.
- Strong value for Microsoft 365 teams
- Wide data connections
- Desktop app free for building reports
- Sharing needs Pro for most business use
- Learning DAX for modelling takes time
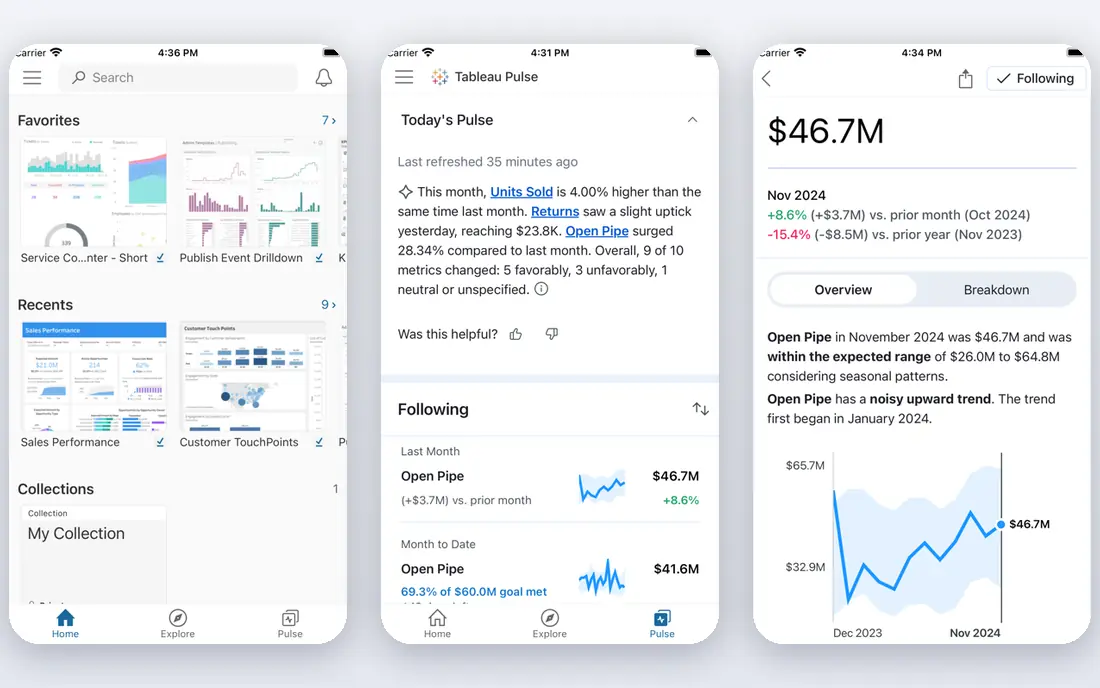
Tableau remains the visual leader in this guide. Drag-and-drop analysis, rich interactivity and polished dashboards make it easy to explore data and present findings, and its community offers many examples and learning paths. Viewer pricing starts around $15 per user per month in recent listings, while Creator, for full authoring, is around $75 per user per month, so price the roles your team actually needs.
Tableau does not centralise metric definitions as strictly as some governed platforms, so large teams should agree measures and data sources before dashboards multiply. For analysis-led teams where visual quality and exploration matter most, Tableau is still the benchmark other tools are judged against.
- Excellent visual analysis and interactivity
- Strong community and learning resources
- Works with many data sources
- Creator pricing is higher for full authoring
- Governance needs care on large deployments
Looker Studio, formerly Google Data Studio, is the best free starting point for reporting, especially for marketing and small business teams using Google tools. You can connect Sheets, Analytics, Ads and other sources, build dashboards in a browser, and share them with a link. For a team that needs weekly marketing or sales reports without a BI budget, it covers a lot of ground at no cost.
Pro, listed at $9 per user per month in recent listings, adds team workspaces, admin controls and scheduled delivery for larger use. Looker Studio is not a replacement for governed enterprise BI, since modelling and data controls are lighter. As a first reporting tool, though, it is hard to beat on price and ease.
- Free for core reporting
- Easy Google Sheets, Analytics and Ads connections
- Simple sharing with a link
- Limited data modelling compared with enterprise BI
- Pro features need a paid plan
Zoho Analytics suits small and mid-sized businesses, especially those already using Zoho CRM, Books or other Zoho apps. The free plan covers small teams, and paid plans start at a low monthly rate in recent listings, with dashboards, data blending and an AI assistant for asking questions in plain language. That combination gives a small team real reporting power without enterprise pricing.
Larger organisations with strict governance, complex data warehouses or heavy compliance needs may find Zoho Analytics lighter than Power BI, Tableau or Looker. For a small team that wants scheduled reports, dashboards and Zoho data in one place, Zoho Analytics is one of the best value picks here.
- Free plan for small teams
- Good value on paid plans
- Strong Zoho app connections and AI assistant
- Fewer enterprise controls than Power BI or Tableau
- Advanced setup still needs data care
Domo is built for organisations that need executive dashboards across many data sources, with data integration, preparation and visualisation in one cloud platform. Leaders get a consistent view of sales, operations and finance, and teams can build data apps and alerts without a separate stack of tools. That breadth suits mid-sized and large companies with varied data.
Pricing is by quote and is enterprise-level, so small teams should start with Looker Studio, Zoho Analytics or Metabase instead. Domo earns its place when data is scattered, executive reporting is a daily need, and a single platform for integration and dashboards saves more time than a cheaper charting tool alone.
- Strong data integration and executive dashboards
- Low-code data preparation
- Good for cross-company reporting
- Quote-based pricing
- Enterprise cost and setup for smaller teams
Qlik Sense suits analysts who like to explore data by clicking, filtering and following associations, rather than only viewing fixed reports. Its associative engine shows related and unrelated data as you select values, which can reveal patterns a static dashboard hides. Dashboards, AI-assisted insights and data preparation tools support both self-service users and central analysts.
Pricing and deployment options vary, so get a written quote for your user count and hosting model. Qlik Sense needs data governance to stay trustworthy at scale, as with any self-service BI tool. For teams that value exploration over fixed reporting, it is a strong alternative to Power BI and Tableau.
- Associative exploration that surfaces related data
- Strong dashboards and AI insights
- Good for analysts who explore freely
- Pricing varies by tier and deployment
- Setup effort for governed deployments
ThoughtSpot changes how business users get answers. Instead of opening a fixed dashboard, a user types a question in plain language and gets a chart or table built from governed data. That search model suits executives and managers who need quick answers without waiting for an analyst, and Essentials pricing starts at $25 per user per month in recent listings.
The catch is data quality. Search works well only when data is clean, modelled and named clearly, so teams need upfront work on sources and measures. If your data is messy, fix that first or choose a dashboard tool that an analyst controls more tightly. With clean data, ThoughtSpot can cut the queue of ad-hoc report requests sharply.
- Search reports in plain language
- Good for business users without SQL
- Embedded analytics options
- Needs clean, well-modelled data to work well
- Higher tiers needed for advanced features
Metabase is the best pick for technical teams that want reporting without a large licence bill. The open-source version is free to self-host, and it offers a visual question builder for business users alongside a SQL editor for analysts. Dashboards, alerts and sharing cover the core reporting jobs, and the cloud version starts at a published monthly rate for teams that prefer hosting handled for them.
Self-hosting needs maintenance, backups and security care, so factor that work into the total cost. Governance, permissions and advanced features also sit mainly on paid plans. For startups, developer-led teams and data teams that already run databases, Metabase gives a fast, low-cost reporting layer that grows with the team.
- Free open-source version for self-hosting
- Easy question builder for non-technical users
- SQL editor for analysts
- Governance and enterprise features need paid plans
- Self-hosting needs technical care
Klipfolio suits marketing teams and agencies that need client-facing dashboards from many sources. Pre-built connections for marketing, sales and social tools, plus custom dashboards and scheduled reports, help agencies show results without building a BI project for each client. White-label and client reporting features are a practical bonus for agency work.
Klipfolio is less focused on deep enterprise data modelling than Power BI, Tableau or Looker, so large data teams may need a different platform for governed analytics. For marketing reporting and agency dashboards, though, its focus and speed make it a strong specialist pick, and a free trial lets you test real client data before you commit.
- Strong marketing and agency dashboards
- Many pre-built data connections
- Client reporting features
- Quote-based pricing on some plans
- Less suited to deep enterprise data modelling
How we picked these
We compared official pricing pages, product pages and public documentation for tools that build dashboards and scheduled reports from real data sources, not just charting a single spreadsheet. We weighed data connections, dashboard quality, sharing, governance, ease of use and cost, and we mixed free, mid-market and enterprise options. We did not claim hands-on testing, and prices are starting prices from vendor listings at the time of writing, so confirm the tier that includes the sharing and governance features you need.
What to check before you buy
Start with your data sources and the one report your team needs every week. Check that the tool connects cleanly to those sources and refreshes on the schedule you need, and test a real dashboard with real data during a trial. Next, map roles: who builds reports, who edits them and who only views them, since viewer and author pricing differs a lot.
Then check governance. Agree how key measures are defined, who can publish a dashboard, and how permissions handle sensitive data. Finally, think about growth. A free tool that works for five people may strain at fifty, while an enterprise tool may be overkill for a small team. Choose the tool that fits your next year, not just this week, and keep the number of reporting tools low so managers trust one source of truth.
Sources
Frequently asked questions
What is the best reporting tool for a small business?
Looker Studio is the best free starting point, and Zoho Analytics is a strong low-cost upgrade, especially for Zoho users. Power BI is the best next step if your team uses Microsoft 365 and needs sharing and modelling at scale.
Is Power BI or Tableau better?
Power BI usually wins on value for Microsoft teams and on sharing costs, while Tableau usually wins on visual depth and exploration. Choose Power BI for broad business reporting at a lower price, and Tableau when visual analysis quality is the top priority.
Is Looker Studio really free?
Yes, for core reporting. Looker Studio is free to build and share dashboards from connected sources, and Pro adds team workspaces, admin controls and scheduled delivery for a monthly fee. Most small teams can start free and only pay if they need Pro controls.
Do I need a data warehouse for reporting tools?
Not always. Small teams can report straight from spreadsheets, CRMs and app connections. As data grows and measures need consistency, a warehouse or a governed data model helps, and tools such as Power BI, Tableau, Looker and Qlik Sense all support that step.
What is the difference between reporting and BI?
Reporting usually means scheduled dashboards and reports from known questions, while business intelligence also covers exploration, modelling and ad-hoc analysis. Many tools here do both, but search tools such as ThoughtSpot and exploration tools such as Qlik Sense lean further toward BI than fixed reporting alone.