Best Server Monitoring Software in 2026: 9 Tools Compared
By ToolNimba Editorial Team November 5, 2026 9 min read

- Top pick
 Datadog
Cloud observability
Starting price$15 per monthCheck out DatadogRead our review - Runner-up
 Zabbix
Free open-source monitoring
Starting priceFreeCheck out ZabbixRead our review - Also great
 PRTG Network Monitor
Windows networks
Starting price$200 per monthCheck out PRTG Network MonitorRead our review
How we researched this
We compared official pricing and feature pages, app store listings, privacy policies and public user reviews. Prices change, so check the provider's site before you pay.
Key takeaways
- Datadog and New Relic suit cloud teams that want full observability in one platform.
- Zabbix and Prometheus suit skilled teams that want powerful monitoring without licence costs.
- PRTG suits Windows-heavy teams that want auto-discovery and sensor-based licensing.
- ManageEngine OpManager suits mid-sized teams with mixed network and server estates.
- Count sensors, hosts, or devices carefully, because that count drives the real bill.
Quick comparison
| Name | Best for | Starting price | Free plan | |
|---|---|---|---|---|
| Datadog | Cloud observability | $15 per month | Yes | Visit |
| Zabbix | Free open-source monitoring | Free | Yes | Visit |
| PRTG Network Monitor | Windows networks | $200 per month | Yes | Visit |
 Prometheus | Cloud-native metrics | Free | Yes | Visit |
 New Relic | Full-stack observability | See website | Yes | Visit |
 SolarWinds Server and Application Monitor | Enterprise server monitoring | See website | Free trial | Visit |
 ManageEngine OpManager | Mid-sized hybrid estates | See website | Free trial | Visit |
 Dynatrace | AI root-cause analysis | See website | Free trial | Visit |
 Checkmk | Hybrid auto-discovery | See website | Yes | Visit |
The best server monitoring software
We compared official pricing pages, deployment options, and monitoring coverage, focusing on server metrics, alerts, dashboards, and integrations. Some tools are software as a service, some are self-hosted, and some offer both, so we note deployment for each. Prices are per host, per sensor, or per device where published, and usage costs can add up on cloud platforms.
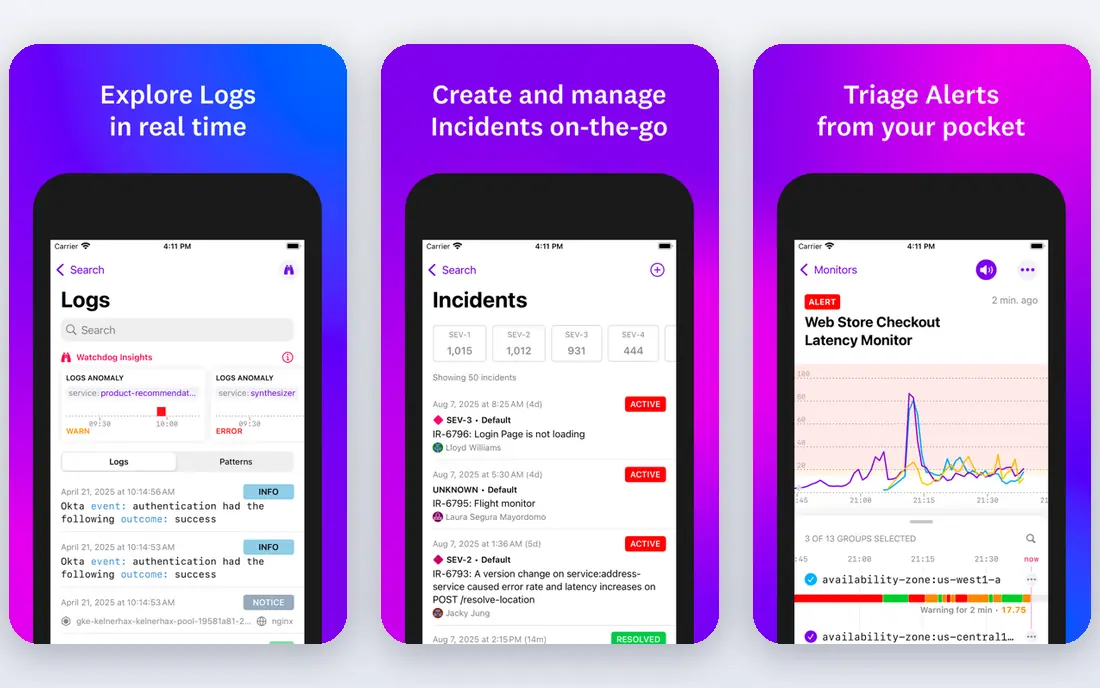
Datadog Infrastructure Pro starts at $15 per host per month on annual billing, with a free tier for up to five hosts, and it covers servers, containers, applications, logs, and synthetic checks in one platform. Its dashboards and alerting help cloud teams spot a failing host, a slow service, or a log spike quickly. Integrations cover most cloud providers, databases, and common services.
Cost control is the main challenge. APM adds about $31 per host per month, logs cost per gigabyte ingested, and custom metrics add further charges, so a bill can grow faster than host count alone suggests. Teams should set ingestion limits and budgets on day one. For cloud teams that value a single observability platform, Datadog remains a leading choice.
- Unified hosts, logs, APM, and synthetics
- Many integrations
- Strong dashboards
- Costs are hard to predict
- Logs and custom metrics add charges
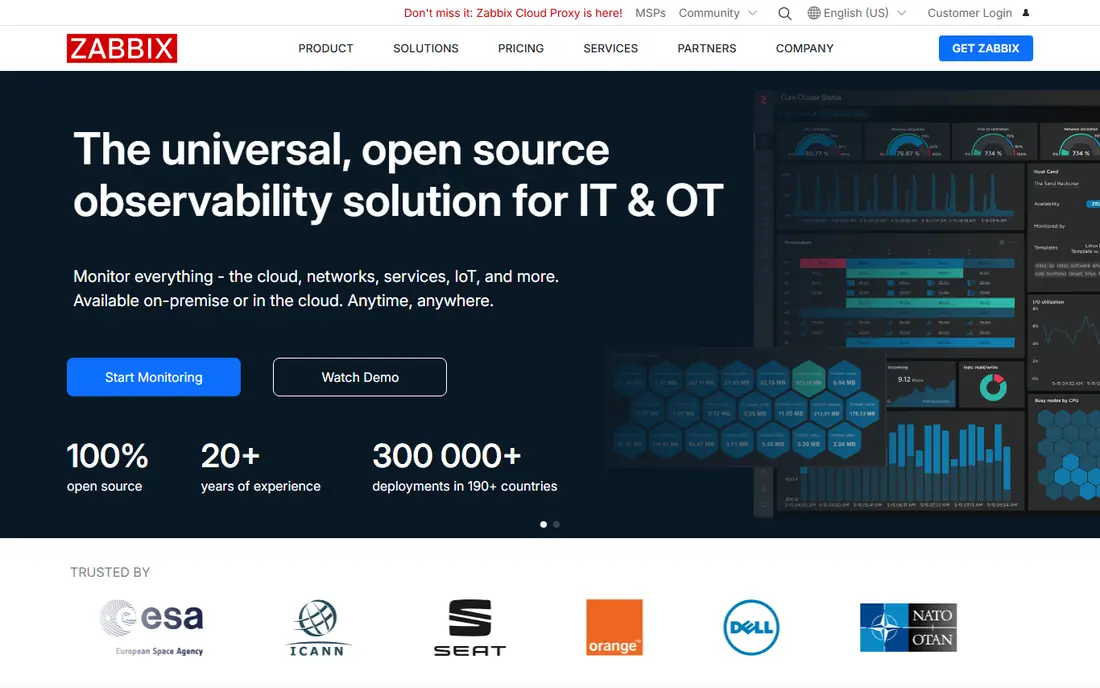
Zabbix is free, open-source monitoring software that collects data via agents, SNMP, IPMI, HTTP, and APIs, and can monitor servers, networks, virtual machines, applications, and cloud services. There is no licence cost for adding another host or switch, which makes it attractive for large estates and tight budgets. Templates, triggers, and dashboards are highly customisable.
That flexibility requires skill. Teams need Linux knowledge, database capacity, and time to design templates, tune triggers, and maintain upgrades. A two-person IT team covering many other jobs may find Zabbix a heavy bargain. For experienced teams, however, it offers enterprise depth without licence fees.
- Free open-source licence
- Monitors servers, networks, VMs, and cloud
- No licence meter
- Needs Linux skills and staff time
- Setup and tuning take effort

PRTG, from Paessler, monitors servers, networks, applications, and virtual environments using SNMP, WMI, flow protocols, and packet sniffing, with auto-discovery to find devices quickly. A free tier covers 100 sensors, and PRTG 500 starts at about $200 a month billed annually, covering 500 sensors or roughly 50 devices by vendor estimates. That sensor model is easy to explain to finance.
Sensors add up fast. A single switch can consume many sensors, one per port or metric, so teams must count sensors during a trial rather than guessing from device count. The interface is functional rather than modern. For Windows-heavy small and mid-sized teams, PRTG remains a practical, well-understood choice.
- Auto-discovery and ready-made sensors
- 100 sensors free
- Friendly setup for Windows teams
- Sensor licensing can grow fast
- Interface feels dated in places
Prometheus is the default open-source metrics system for Kubernetes and cloud-native workloads, collecting time-series metrics and offering a powerful query language for alerts and dashboards. It is free to self-host, integrates well with Grafana for visualisation, and supports OpenTelemetry data. Many cloud teams already use it as their metrics core.
It is a building block, not a finished product. Long-term storage, alert routing, and dashboards usually need Grafana, Alertmanager, and other tools, and someone must maintain them. Teams without that operational capacity may prefer a hosted platform such as Grafana Cloud or Datadog. For Kubernetes teams with platform skills, Prometheus is a strong foundation.
- Free open-source metrics
- Standard for Kubernetes
- Strong query language
- Self-hosting is operationally heavy
- Long-term storage and alerting need extra tools
New Relic offers infrastructure monitoring, application performance monitoring, logs, and synthetics in one platform, with a free tier that includes 100GB of data ingestion a month in recent comparisons. Agents are easy to install, and dashboards help teams link a server issue to an application error. It suits software as a service companies that need both server and application views.
Pricing is usage-based, with charges tied to data volume and users, so costs can be harder to predict than a simple per-host price. Teams should monitor ingestion and set limits. For teams that want full-stack visibility with a generous free start, New Relic is worth a trial.
- Full-stack observability
- Generous free data tier
- Easy agent setup
- Usage pricing can be complex
- Costs rise with data volume
SolarWinds Server and Application Monitor
Best for: Enterprise server monitoring
SolarWinds Server and Application Monitor, often called SAM, monitors physical and virtual servers, applications, and databases with hundreds of built-in templates. It suits enterprise and mid-sized teams with Windows servers, VMware or Hyper-V estates, and complex applications that need template-based monitoring. Alerting and reporting are mature.
Pricing is not a simple published entry price, and deployment benefits from a clear plan for templates and thresholds. Smaller teams may find it heavy and costly compared with PRTG or Zabbix. For large Windows and virtual estates already using SolarWinds tools, SAM offers deep, familiar coverage.
- Deep server and application templates
- Good for Windows and virtual estates
- Strong alerting
- Pricing is quote-based
- Implementation needs planning
ManageEngine OpManager monitors servers, networks, virtual machines, and storage from one console, using SNMP, WMI, and CLI collection, with workflow automation for routine responses. It suits mid-sized teams with mixed Cisco, Juniper, Fortinet, and HP estates, plus Windows and Linux servers. On-premises and cloud deployment options add choice.
Pricing is per device and typically requires a quote, so comparison needs an actual device count. The interface prioritises function over polish. For mid-sized IT teams that want servers and networks together without an enterprise observability bill, OpManager is a practical option.
- Servers, networks, and VMs in one tool
- Workflow automation
- On-premises and cloud options
- Pricing is per device and needs a quote
- Interface is functional rather than modern
Dynatrace uses a single OneAgent to collect infrastructure, application, log, and user experience data, and its Davis AI engine aims to pinpoint root cause rather than just alerting on symptoms. That makes it powerful for large, complex estates where an outage can have many possible causes. It scales to hundreds of hosts and integrates with major clouds.
Pricing is usage-based, with host monitoring reported from about $29 per host per month, and full observability costs more. Small teams will find it complex and costly. For enterprises with 100 or more hosts and a need for fast root-cause analysis, Dynatrace is a leading contender.
- Strong AI root-cause analysis
- Single agent for many data types
- Enterprise scale
- Usage-based pricing from about $29 per host per month
- Complex for small teams
Checkmk monitors servers, networks, cloud, and containers with auto-discovery and more than 2,000 plugins, using rule-based configuration that suits distributed sites. Its Raw edition is free and open source, while Enterprise adds features and support with service-based pricing, reported at about $225 a month for a 100-host estate in some comparisons. That mix suits hybrid IT shops.
Rule-based configuration takes learning, especially for teams new to Checkmk, and Enterprise costs depend on service count, not just host count. Teams should trial it with their real estate to see service counts. For hybrid teams that want auto-discovery and strong plugin coverage, Checkmk is a solid choice.
- Auto-discovery with 2,000 plus plugins
- Raw edition free
- Rule-based configuration
- Enterprise pricing is per service
- Setup needs learning time
How we picked these
We compared vendor pricing pages, deployment options, and monitoring coverage, and we favoured tools that monitor servers clearly, offer alerts and dashboards, and are widely used in 2026. We included software as a service, self-hosted, and hybrid options, and we noted where pricing is per host, per sensor, per device, or usage-based. We did not claim hands-on testing, and we flagged where costs can grow with data volume.
Choosing monitoring without bill shock
Start by listing what you must monitor: servers, containers, networks, applications, or all four. A server-only team can use PRTG, Zabbix, or OpManager, while a cloud application team may need Datadog, New Relic, or Dynatrace. Do not pay for application monitoring if you only need host uptime and CPU data.
Count the unit that drives price
For PRTG, count sensors. For Datadog and Dynatrace, count hosts and data volume. For OpManager, count devices. Run a trial with your real estate, not a small demo set, and export the count before you sign. That single check prevents most monitoring bill surprises.
Test alerts before you rely on them
Set up alerts for CPU, disk, memory, and service failure, then trigger a test failure and check who gets notified and how fast. An alert that goes to the wrong channel, or that fires too often, will be ignored when a real outage happens. Tune thresholds in the first month.
Sources
Frequently asked questions
What is server monitoring software?
Server monitoring software tracks CPU, memory, disk, network, and service health on servers, then alerts teams when thresholds are crossed. It usually includes dashboards, history, and integrations with alerting tools, so teams can spot and fix problems before users notice.
How much does server monitoring software cost?
Costs vary by model. Zabbix and Prometheus are free to self-host, PRTG starts at about $200 a month for 500 sensors, Datadog starts at $15 per host per month, and enterprise platforms use usage-based or quote pricing. Always check data, sensor, or device counts, because they drive the total.
Is Zabbix good for small teams?
Zabbix is powerful and free, but it needs Linux skills and maintenance time. A skilled small team can run it well, while a team without that time may prefer PRTG, a hosted platform, or ManageEngine OpManager for faster setup.
Do I need Datadog or New Relic for simple server monitoring?
No, if you only need host metrics and uptime. PRTG, Zabbix, OpManager, or Checkmk cover that well at lower cost. Datadog and New Relic add value when you also need application performance, logs, and user experience data in one platform.
What is the difference between monitoring and observability?
Monitoring tracks known metrics and alerts on thresholds, such as CPU over 90 percent. Observability adds logs, traces, and metrics together so teams can investigate unknown problems and find root cause. Most modern platforms offer both, but observability usually costs more in data volume.