Best Stock Analysis App in 2026: 9 Apps Compared
By ToolNimba Editorial Team November 9, 2026 10 min read

- Top pick
 TradingView
Charting and technical analysis
Starting price$12.95 per monthCheck out TradingViewRead our review - Runner-up
 Yahoo Finance
Free quotes, news and portfolios
Starting priceFreeCheck out Yahoo FinanceRead our review - Also great
 Seeking Alpha
Quant ratings and contributor research
Starting priceSee websiteCheck out Seeking AlphaRead our review
How we researched this
We compared official pricing and feature pages, app store listings, privacy policies and public user reviews. Prices change, so check the provider's site before you pay.
Key takeaways
- No single app covers charts, fundamentals, analyst views and screening equally well, so most investors use two tools together.
- TradingView leads for charting, Stock Rover and Koyfin lead for deep screening, and Morningstar and Seeking Alpha lead for research depth.
- Free plans are useful for quotes, news and basic screens, but real-time data, long histories and advanced screens usually sit behind paid plans.
- Treat every rating, score and target price as one input, not a promise, and check the primary filing before you act on an idea.
Quick comparison
| Name | Best for | Starting price | Free plan | |
|---|---|---|---|---|
| TradingView | Charting and technical analysis | $12.95 per month | Yes | Visit |
| Yahoo Finance | Free quotes, news and portfolios | Free | Yes | Visit |
| Seeking Alpha | Quant ratings and contributor research | See website | Yes | Visit |
 Morningstar Investor | Independent ratings and fund research | $34.95 per month | No | Visit |
 Stock Rover | Deep screening and portfolio analytics | $29 per month | Yes | Visit |
 Finviz | Fast US stock screening | Free | Yes | Visit |
 Koyfin | Dashboards and financial data | Free | Yes | Visit |
 Simply Wall St | Visual fundamental summaries | Free | Yes | Visit |
 TipRanks | Analyst consensus and insider tracking | Free | Yes | Visit |
The best stock analysis apps
Stock analysis means different work for different investors. Some people start with a chart, others start with earnings, cash flow and valuation, and others start with what analysts and insiders are doing. We compared official pricing pages, product pages and public documentation, and we focused on data coverage, screening depth, charting, research quality and cost. This is not financial advice, and trading and investing carry risk, including the risk of loss.
TradingView is the chart-first pick in this guide. Its charts are fast, flexible and easy to read, with indicators, drawing tools, alerts and multi-chart layouts that suit both short-term traders and longer-term investors who watch price trends. Screeners cover stocks, ETFs and other markets, and the community library adds ideas and scripts you can study and adapt.
The limit is depth on fundamentals. You can see key financials and news, but a deep valuation or earnings model needs a research tool such as Morningstar, Stock Rover or Koyfin. If your process starts with price action and you want clean charts on phone and desktop, TradingView is our pick for most people in that group.
- Excellent charts and drawing tools
- Screeners across many markets
- Large community of shared ideas and scripts
- Fundamental data is thinner than specialist research tools
- Real-time data and extra features need paid plans
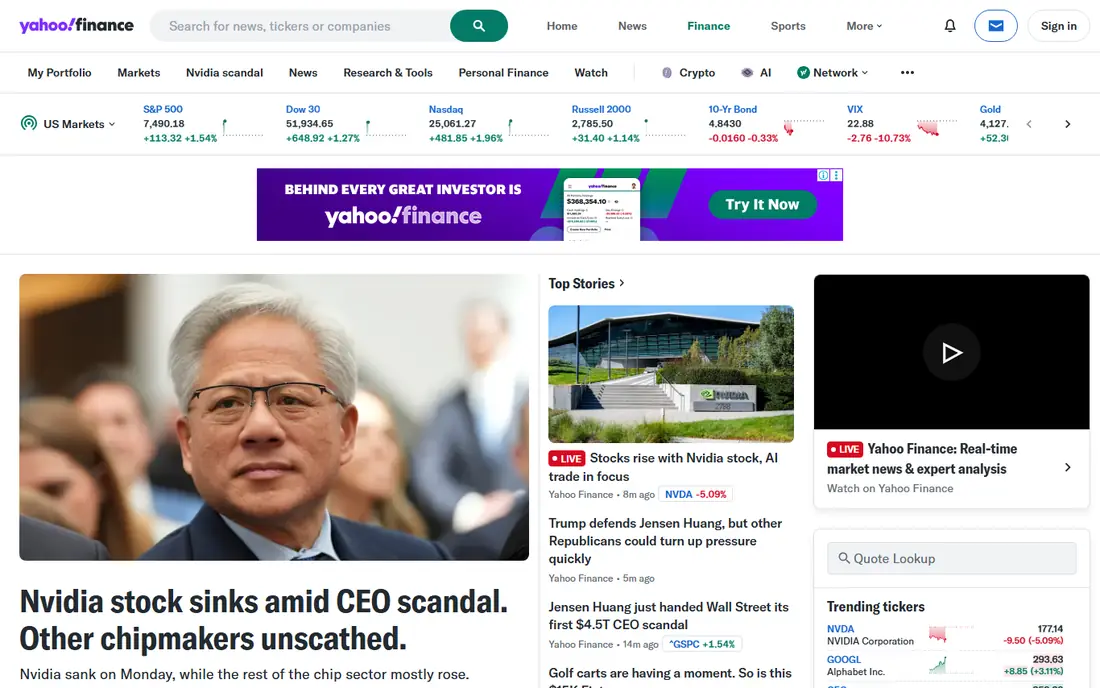
Yahoo Finance remains the best free starting point for everyday stock research. You get quotes, charts, news, financial statements, analyst estimates and portfolio tracking without paying, and the app is simple enough for a new investor to use on day one. For checking a ticker, following a watchlist and reading market news, it covers the basics well.
Paid tiers add research reports, fair-value estimates and longer histories, but many casual investors will never need them. Yahoo Finance is less powerful for complex screening than Stock Rover or Finviz Elite, and its charts are simpler than TradingView. Use it as your free base, then add a specialist tool only when you hit a clear limit.
- Free quotes, news and portfolio tracking
- Broad market coverage
- Easy to use for beginners
- Advanced research and fair-value tools need paid tiers
- Ads and upsells appear in the free experience
Seeking Alpha combines data-driven ratings with a very large library of written analysis. Its Quant Ratings grade stocks on factors such as value, growth, momentum and profitability, which gives readers a structured starting point before they read opinions. Screeners let you filter by rating and other factors, and alerts keep you posted on companies you follow.
The trade-off is that contributor articles are opinions, not advice, and quality varies from author to author. Treat the Quant Rating as a screen, read the reasoning behind it, and check earnings reports and filings before you decide. For investors who like to read widely before buying, Seeking Alpha offers more written research in one place than most rivals.
- Quant ratings across thousands of stocks and ETFs
- Large library of contributor analysis
- Screeners and alerts
- Contributor quality varies
- Full Premium access is a yearly subscription
Morningstar Investor suits investors who want independent, structured research rather than a stream of opinions. Its analyst ratings, portfolio insights and screening tools help you compare stocks, funds and ETFs on a consistent basis. Fund investors in particular benefit, since Morningstar has long covered funds, fees and portfolio holdings in depth.
The price is the main barrier. At $34.95 per month, or $249 per year in recent listings, it is a serious subscription for a casual investor. If you mainly trade a few stocks and follow price charts, a cheaper tool will do. If you build a long-term portfolio across funds and ETFs and want a second, independent view, Morningstar is worth the trial.
- Respected analyst ratings and research
- Strong fund and ETF coverage
- Portfolio tools and screening
- Higher monthly price
- More research depth than many casual investors need
Stock Rover is built for investors who want to build their own screens rather than follow someone else's picks. It offers hundreds of metrics, long histories and detailed portfolio analytics, and it can screen across a wide universe including many smaller stocks. For a fundamental investor with a clear process, that depth is the main attraction.
New users should expect a learning curve. The interface is dense, and the most useful analytics sit on paid plans, starting around $29 per month billed annually for Premium in recent listings. If you screen weekly and track a real portfolio, Stock Rover earns its price. If you only check a few tickers, start with Yahoo Finance or Finviz first.
- Hundreds of screening metrics
- Long fundamental histories
- Detailed portfolio analytics and brokerage sync on higher plans
- Interface takes time to learn
- Best features sit on higher-priced plans
Finviz is the fastest way to run a first-pass screen on US stocks. Its screener, heat maps and market overview let you filter by valuation, performance, technical signals and other factors in seconds, and each stock page gives a compact snapshot of price, fundamentals and news. Many experienced investors use Finviz daily as a starting filter, then move to another tool for deeper work.
Elite, listed at $39.50 per month or $299.50 per year in recent listings, adds real-time data, longer histories, alerts and more. Free users get delayed data and a solid screener, which is enough for many long-term investors. Finviz is not a full research platform, but as a fast screening front door it is hard to beat.
- Very fast screener and market maps
- Clean snapshots of key data
- Elite adds real-time data and alerts
- Charts are basic compared with TradingView
- Coverage is mainly US-focused
Koyfin appeals to investors who want a clean, data-rich dashboard they can shape themselves. You can build watchlists, charts, tables and screens from financial data, filings and estimates, and track a portfolio across markets. The free plan is useful for quotes and basic research, while Plus, listed at $39 per month in recent listings, adds longer histories and deeper data.
Koyfin sits between a charting app and a research terminal. It will not replace TradingView for advanced technical work, and it will not replace Morningstar for analyst research. As a central dashboard for fundamental data, though, it is one of the most practical tools here, especially for investors who follow global stocks.
- Flexible dashboards and watchlists
- Long financial histories on paid plans
- Good global coverage
- Charting is simpler than TradingView
- Paid plans are needed for full histories and filings access
Simply Wall St turns dense financial data into visual summaries that are easy to grasp at a glance. Its Snowflake view breaks a company into value, future performance, past performance, financial health and dividends, which helps newer investors see where a company looks strong and where it looks weak. Portfolio tracking and screening add practical value beyond the visuals.
Visual summaries are a starting point, not a verdict. A company can look strong on a chart and still face risks that only a filing, an earnings call or a news story reveals. Use Simply Wall St to narrow a list and learn the basics, then verify valuation, debt and cash flow in a deeper tool before you invest.
- Visual Snowflake summaries of strengths and risks
- Easy portfolio tracking
- Helpful for newer fundamental investors
- Summaries simplify complex companies
- Full access needs a paid plan
TipRanks is useful when you want to know what analysts, insiders and large investors are doing, rather than just what a chart shows. It aggregates analyst ratings and price targets, tracks insider trades and hedge fund holdings, and summarises stocks with a Smart Score. That mix helps you spot where professional opinion is shifting.
Analyst targets are opinions with a mixed record, and they move as earnings and news change, so never treat a consensus target as a price promise. TipRanks works best as a sentiment check alongside your own fundamental work. If you follow analyst moves closely, it adds a view that charting and screening tools alone do not give.
- Analyst ratings, price targets and consensus views
- Insider and hedge fund activity tracking
- Smart Score summaries
- Analyst targets change often and are not guarantees
- Best features need a paid plan
How we picked these
We compared official pricing pages, product pages and public documentation for apps that offer real stock analysis, not just trading or news. We weighed charting, screening depth, fundamental data, analyst and fund research, and cost, and we included free and paid options for different styles. We did not claim hands-on testing, and we did not verify returns, ratings accuracy or future performance. Prices are starting prices from vendor listings at the time of writing, so confirm the plan that includes the data you need.
What to check before you choose
Start with your process. Chart traders should prioritise TradingView, fundamental screeners should prioritise Stock Rover, Finviz or Koyfin, and research readers should prioritise Morningstar or Seeking Alpha. Next, check data delays and coverage for the markets you follow, since free plans often use delayed data and paid plans vary by exchange.
Test a real workflow during a trial: build a screen, save a watchlist, set an alert and export or review a portfolio. Check whether the app covers the stocks you own, including smaller names, and whether histories go back far enough for your style. Finally, keep costs in check. Two well-chosen tools usually beat five overlapping subscriptions, and a free base such as Yahoo Finance can cover much of the everyday work.
Sources
Frequently asked questions
What is the best stock analysis app for beginners?
Yahoo Finance is the best free starting point, because it covers quotes, news, financials and portfolios in one simple app. Simply Wall St is a good second step for visual fundamentals, and TradingView is the best next step if you want to learn charting.
Is TradingView or Stock Rover better?
They do different jobs. TradingView is better for charts, technical analysis and multi-market screening, while Stock Rover is better for deep fundamental screening and portfolio analytics. Many investors use TradingView for price action and Stock Rover for fundamentals.
Do I need to pay for stock analysis?
Not always. Free plans from Yahoo Finance, Finviz, TradingView and Koyfin cover quotes, basic screens and news. Paid plans matter when you need real-time data, long histories, advanced screens, analyst research or alerts that free tiers limit.
Are analyst ratings and stock scores reliable?
They are useful inputs, not guarantees. Ratings and scores reflect models and opinions at a point in time, and they change as earnings, prices and news change. Always read the reasoning, check the primary filing, and compare more than one source before you act.
Can one app replace a broker app?
No, in most cases. Analysis apps help you research and track ideas, while broker apps place trades and hold your account. Some brokers include research tools, but a dedicated analysis app usually offers deeper screening, charting or research than a broker app alone.