Best System Monitoring Software in 2026: 9 Tools Compared
By ToolNimba Editorial Team November 11, 2026 9 min read

- Top pick
 Datadog
All-in-one cloud observability
Starting price$15 per monthCheck out DatadogRead our review - Runner-up
 New Relic
Application performance on a budget
Starting priceFreeCheck out New RelicRead our review - Also great
 Dynatrace
AI-assisted root cause analysis
Starting price$7 per monthCheck out DynatraceRead our review
How we researched this
We compared official pricing and feature pages, app store listings, privacy policies and public user reviews. Prices change, so check the provider's site before you pay.
Key takeaways
- Datadog and Dynatrace lead for full-stack observability, but their bills grow with every host, metric and log you add.
- Zabbix and Grafana Cloud give small teams real monitoring for little or no money, if you accept more setup work.
- PRTG, SolarWinds and ManageEngine OpManager suit Windows and network-heavy shops that want on-premises control.
- Nagios XI remains a solid choice for teams that already know Nagios and want a one-time license rather than a monthly meter.
Quick comparison
| Name | Best for | Starting price | Free plan | |
|---|---|---|---|---|
| Datadog | All-in-one cloud observability | $15 per month | Yes | Visit |
| New Relic | Application performance on a budget | Free | Yes | Visit |
| Dynatrace | AI-assisted root cause analysis | $7 per month | Free trial | Visit |
 SolarWinds Observability | Hybrid IT estates | $8 per month | Free trial | Visit |
 PRTG Network Monitor | Network and device monitoring | $200 per month | Free trial | Visit |
 Zabbix | Free open source monitoring at scale | Free | Yes | Visit |
 Nagios XI | Traditional server and network checks | $1,995 one-time | Free trial | Visit |
 Grafana Cloud | Open source dashboards and alerts | Free | Yes | Visit |
 ManageEngine OpManager | Device-based network monitoring | See website | Free trial | Visit |
The best system monitoring software
Good monitoring tells you something is wrong before your users do, and it points at the cause instead of just flashing red. The tools below cover that job from different angles, from cloud platforms to self-hosted classics.
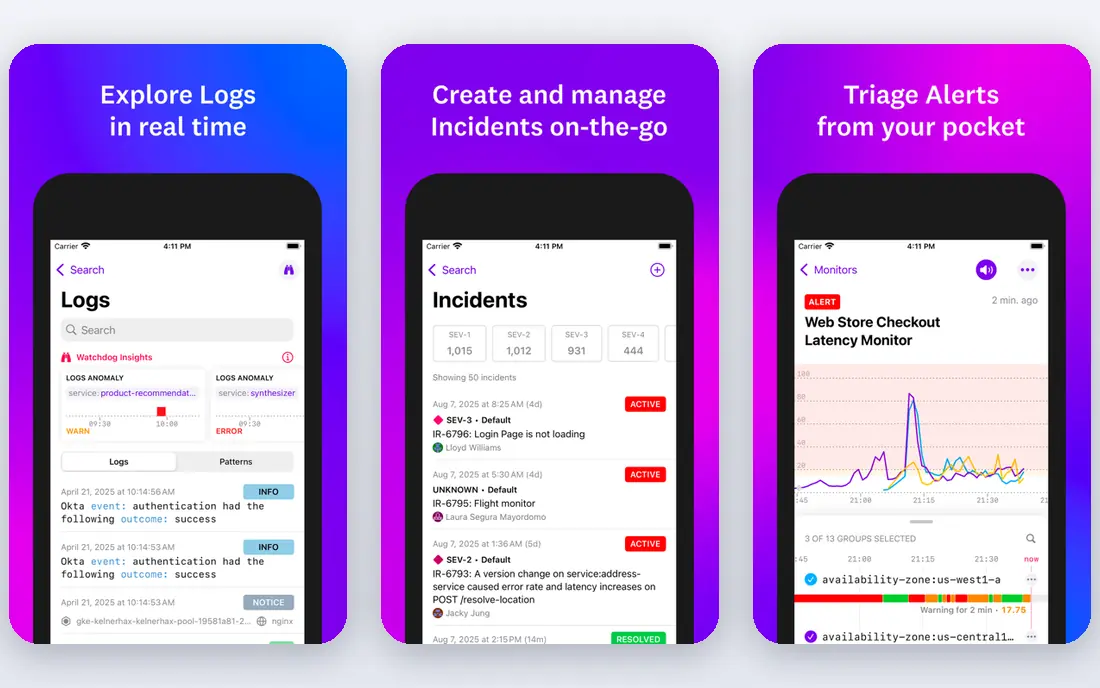
Datadog is our pick for teams that want infrastructure monitoring, application performance monitoring and logs in one place. Its agent collects a lot by default, and its dashboards make it easy to move from a slow endpoint to the host and log lines behind it. That breadth is the main reason larger teams standardize on it.
The catch is cost discipline. Infrastructure Pro starts at $15 per host per month billed annually, and application monitoring, logs and other products are charged on top. A free tier covers up to 5 hosts with 1-day retention, which suits a side project but not production. Set usage alerts early, or a busy month will surprise you.
- Wide integration library
- Strong correlation between metrics, traces and logs
- Polished dashboards
- Bills stack up across products
- Pricing is hard to forecast

New Relic suits small teams that want serious application monitoring without a per-host meter. The free tier includes 100 GB of data ingest per month and one full platform user, which is enough for many small applications. Paid Standard starts with a $10 first full user, then $99 per additional user per month.
The trade-off is data volume. Once you pass the free allowance, ingest is charged per gigabyte, so noisy logging can inflate the bill. Keep log levels tight in production and use the free basic users for people who only need to view dashboards.
- Generous free tier with 100 GB of data per month
- All features available on every plan
- Simple per-user pricing
- Data overage charges add up
- Advanced support sits on higher tiers
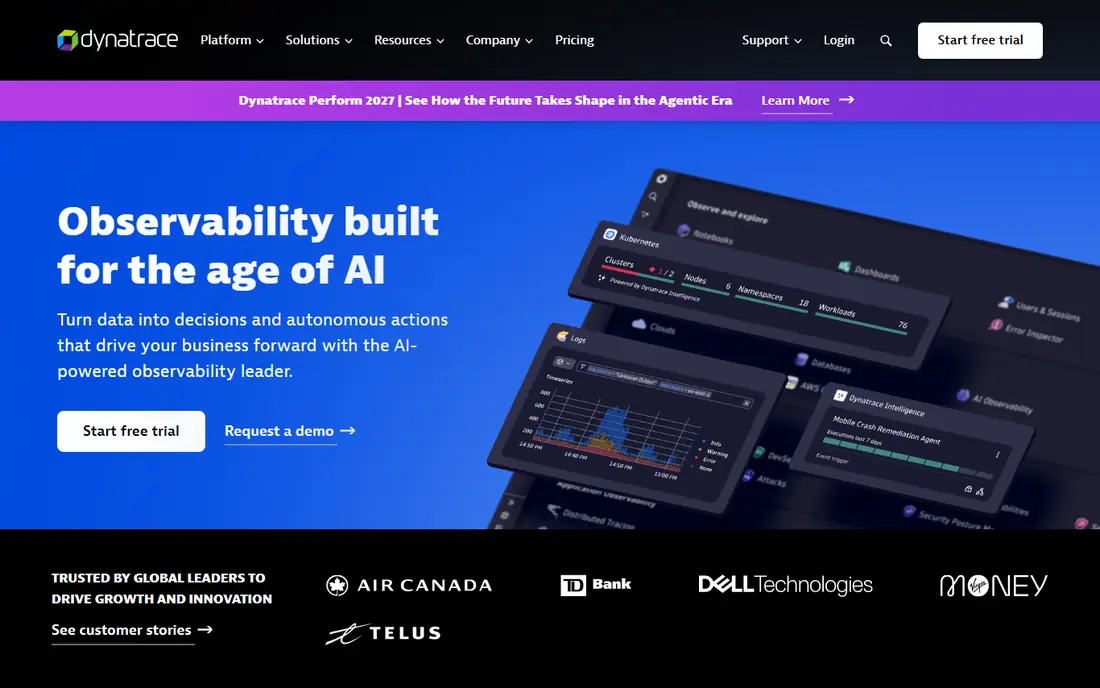
Dynatrace is the choice when you want the platform to do more of the detective work. Its OneAgent maps services, processes and dependencies automatically, and its AI engine, Davis, links problems to likely causes. Foundation monitoring starts at $7 per host per month, while Infrastructure Monitoring starts at $29 per host per month.
The pricing model takes care to understand. Dynatrace now sells an annual platform commitment that usage draws down against, rather than a simple monthly plan. That works well for enterprises with predictable estates, but smaller teams should use the trial to model their real consumption first.
- Automatic topology mapping
- Strong AI root cause analysis
- Single agent per host
- Annual commitment model
- Full-stack pricing depends on host memory
SolarWinds Observability fits organizations split between on-premises servers and cloud services. The self-hosted edition starts at $8 per node per month, and the SaaS edition prices modules such as network, application and log observability separately. A 30-day trial covers the full product.
The honest catch is commitment. Pricing is quoted on multi-year contracts billed annually, so this is a decision to make after a proper trial, not on a headline price. Teams already running SolarWinds network tools will get the most value, since the learning curve is shorter.
- SaaS or self-hosted deployment
- Long network monitoring heritage
- Unified metrics, traces and logs
- Multi-year contracts billed annually
- SaaS modules are priced separately
PRTG is a favorite in network-heavy offices because its model is simple: each thing you monitor is a sensor, and licenses are sold by sensor count. PRTG 500, which covers about 50 devices, starts at $200 per month paid annually. Setup is quick, with auto-discovery building a device tree you can then tune.
The limit to watch is sensor sprawl. Ten sensors per device is normal, so a 50-device network can chew through a 500-sensor license quickly. The Windows-only core server is also a constraint for Linux-first shops. For a single-site network team, though, few tools are faster to get running.
- Sensor-based model is easy to grasp
- Auto-discovery finds devices fast
- Strong SNMP and flow support
- Windows-only core server
- Costs rise with sensor count
Zabbix is the strongest free option for teams with real technical skill. It is open source under the GPL, so there is no license fee no matter how many hosts you monitor. Templates cover common servers, switches, databases and cloud services, and its proxy architecture handles remote sites well.
The price you pay is time. Installation, database tuning, upgrades and alert design are your job, and the interface takes longer to learn than a polished SaaS product. Paid support and a managed Zabbix Cloud option exist if you want help. For budget-conscious teams with Linux experience, it is hard to beat.
- No license fee and no per-host charge
- Monitors networks, servers and applications
- Mature template library
- Steep learning curve
- You run and maintain the server yourself
Nagios XI is the commercial edition of the monitoring classic, built on Nagios Core. It adds a web interface, configuration wizards, reporting and dashboards to the check-based engine that sysadmins have used for decades. Standard licensing starts at $1,995 per instance, with higher node counts priced above that.
Nagios suits teams that want a known quantity and a license they own. Thousands of community plugins cover unusual devices and services. The downside is age: building elegant dashboards and modern alert workflows takes more effort here than in Datadog or Grafana, and the interface shows its years.
- Huge plugin ecosystem
- Predictable one-time license
- Proven in production for years
- Interface feels dated
- Configuration takes more manual work than modern SaaS tools
Grafana Cloud wraps the popular open source Grafana, Loki, Mimir and Tempo projects into a managed service. The free tier includes 10,000 active metric series, 50 GB of logs and 50 GB of traces per month, with 3 users. Pro starts at $19 per month plus usage.
This is our pick for teams that already use Prometheus or want to avoid vendor lock-in, since the same dashboards can run against a self-hosted stack. The catch is the usage model: active series and log volume decide the bill, so label discipline matters. If you want one vendor to own the whole problem, Datadog is simpler.
- Generous free tier
- Open source stack you can self-host
- Excellent dashboards
- Usage-based pricing can surprise
- Assembling the full stack takes skill
OpManager, from ManageEngine, monitors networks, servers, virtual machines and storage from one console, with device-based licensing instead of per-metric charges. Standard, Professional and Enterprise editions scale from small offices to multi-site networks, and a 30-day trial is available.
It fits IT teams that live in Windows environments and want monitoring plus basic automation without a cloud bill. Pricing varies by device count and edition, so get a quote for your device total before comparing it with sensor-based PRTG. The interface packs a lot in, which takes a week or two to learn.
- Device-based licensing is easy to budget
- Strong Windows and virtualization coverage
- Workflow automation included
- Interface can feel busy
- Some advanced features need higher editions or add-ons
How we picked these
We compared official pricing pages, feature documentation and public user reviews for tools that monitor systems, networks or applications and are actively maintained in 2026. We favored products with a clear pricing page or a genuine free tier, and we excluded tools that only do uptime checks or only monitor websites. Prices shown are starting prices from vendor pages or reputable pricing roundups checked in October 2026, and they change with billing terms and volume.
What to check before you buy
Start with what you actually run. A cloud-native team with containers and microservices needs tracing and log correlation, while a single-office network team needs SNMP, flow data and switch monitoring. Buying a full observability platform for the second job wastes money, and buying a network monitor for the first leaves developers blind.
Next, model the bill at twice your current size. Per-host, per-sensor and per-gigabyte pricing all punish growth, and free tiers that look generous at 10 hosts can vanish at 50. Ask for the retention period too, since short retention makes post-incident investigation painful. Finally, test alerting during the trial: a tool that pages you at 3 a.m. for a flapping interface is worse than no tool at all.
Deployment and data control
SaaS tools are fastest to start and easiest to keep updated, but your metrics and logs leave your network. Self-hosted tools such as Zabbix, Nagios XI and PRTG keep data inside your firewall, which matters for regulated environments. Some vendors offer both, so ask whether the SaaS and self-hosted editions have the same features before you commit.
Alerting and on-call fit
Check how alerts reach your team, whether thresholds adapt to normal patterns, and whether the tool integrates with your chat or ticketing system. The best monitoring tool is the one your team actually responds to, so involve the people who will carry the pager in the trial.
Sources
- https://www.datadoghq.com/pricing/
- https://newrelic.com/pricing
- https://www.dynatrace.com/pricing/
- https://www.solarwinds.com/pricing
- https://www.paessler.com/pricing
- https://www.zabbix.com/pricing
- https://www.nagios.com/products/nagios-xi/
- https://grafana.com/pricing/
- https://www.manageengine.com/network-monitoring/opmanager-editions.html
Frequently asked questions
What is the best system monitoring software for a small business?
For a small team, start with Grafana Cloud or New Relic, since both have real free tiers, or Zabbix if you have Linux skills and want no license cost. Datadog is stronger but harder to justify until you have enough hosts and budget to use its full platform.
Is there a good free system monitoring tool?
Yes. Zabbix is free and open source with no host limit, and Grafana Cloud and New Relic both offer free tiers for small estates. Free tiers usually cap retention or data volume, so check those limits before relying on them in production.
What is the difference between monitoring and observability?
Monitoring usually means collecting metrics and alerting when thresholds break. Observability adds logs and traces so you can ask new questions about a problem you did not predict, such as why one request path is slow. Most modern platforms sell both under one name.
Do I need an agent on every server?
Most full-stack tools need an agent for deep metrics, while network tools can monitor switches and routers agentlessly over SNMP. Agentless checks are simpler but give less detail about processes and applications running on a host.
How much should system monitoring cost?
It ranges from free for Zabbix to $15 or more per host per month for Datadog infrastructure monitoring, plus extra products. Budget by host count, log volume and retention, and re-check the bill quarterly, since all three tend to creep upward.