Best Alternatives to InfluxDB in 2026: 9 Time Series Databases Compared
By ToolNimba Editorial Team November 12, 2026 9 min read

- Top pick
 TimescaleDB
Postgres teams moving to time series
Starting priceSee websiteCheck out TimescaleDBRead our review - Runner-up
 QuestDB
Fast SQL queries on high volume data
Starting priceFreeCheck out QuestDBRead our review - Also great
 ClickHouse
Large analytical workloads
Starting priceFreeCheck out ClickHouseRead our review
How we researched this
We compared official pricing and feature pages, app store listings, privacy policies and public user reviews. Prices change, so check the provider's site before you pay.
Key takeaways
- If your team already runs Postgres, TimescaleDB is the lowest friction move, since it keeps standard SQL and the Postgres ecosystem.
- QuestDB and VictoriaMetrics suit teams that want strong ingest speed and low operating cost on modest hardware.
- Prometheus and Grafana Mimir fit monitoring workloads, while ClickHouse and Apache Druid fit large analytical queries.
- Most of these tools are open source at the core, so the real cost is hosting, operations, and support, not a license fee.
- Test with your own data shape and query pattern before you commit, because time series performance depends heavily on cardinality and retention.
Quick comparison
| Name | Best for | Starting price | Free plan | |
|---|---|---|---|---|
| TimescaleDB | Postgres teams moving to time series | See website | Yes | Visit |
| QuestDB | Fast SQL queries on high volume data | Free | Yes | Visit |
| ClickHouse | Large analytical workloads | Free | Yes | Visit |
 VictoriaMetrics | Efficient long term metric storage | Free | Yes | Visit |
 Prometheus | Cloud native monitoring and alerting | Free | Yes | Visit |
 TDengine | Industrial and IoT sensor data | Free | Yes | Visit |
 Apache Druid | Real time analytics applications | Free | Yes | Visit |
 CrateDB | Device data mixed with metadata | Free | Yes | Visit |
 Grafana Mimir | Long term Prometheus storage at scale | Free | Yes | Visit |
The best alternatives to InfluxDB
These nine options cover the main reasons teams move on from InfluxDB, from wanting plain SQL to needing lower storage costs at scale.
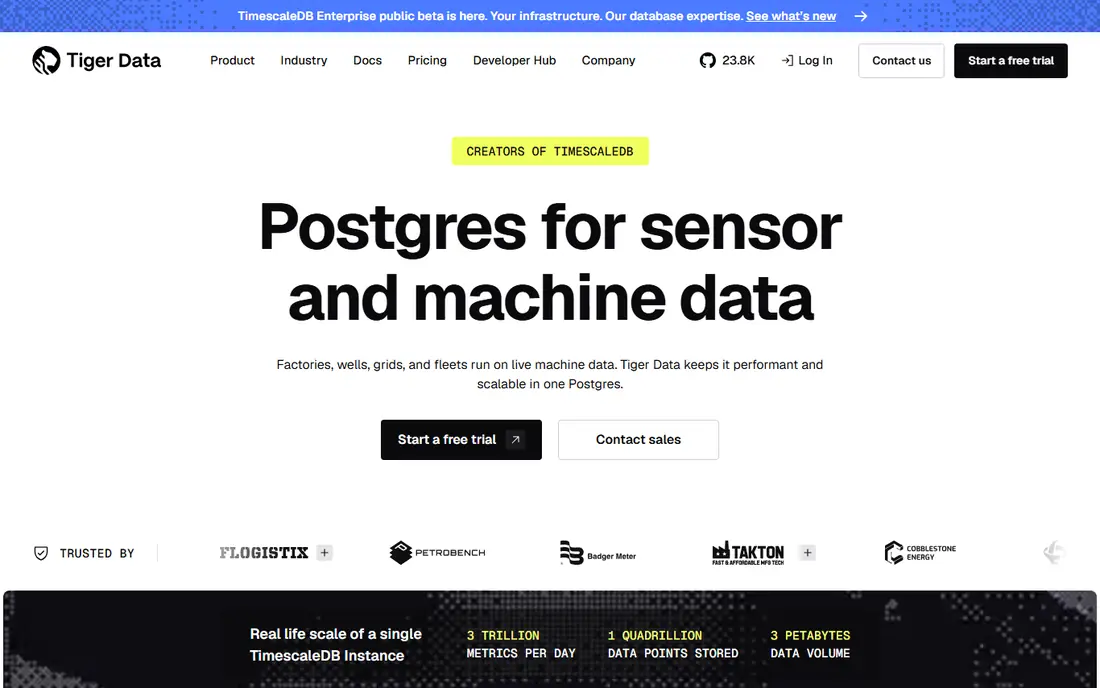
TimescaleDB, now offered by Tiger Data, builds time series features on top of Postgres. That matters if your team already knows Postgres, because you keep familiar SQL, drivers, and tooling instead of learning a new query language. It also handles relational data next to time series data, which helps when device readings need to sit beside customer, asset, or order records.
The trade off is operational weight. A Postgres based system asks more of your team than a small single binary metrics store, and costs rise with the compute and storage you provision. For teams that already run Postgres in production, though, that familiarity often outweighs the extra weight, and it makes migration planning much simpler.
- Standard SQL and Postgres compatibility
- Wide ecosystem of Postgres tools
- Managed cloud option
- Heavier than a single purpose metrics store
- Cloud pricing depends on compute and storage choices
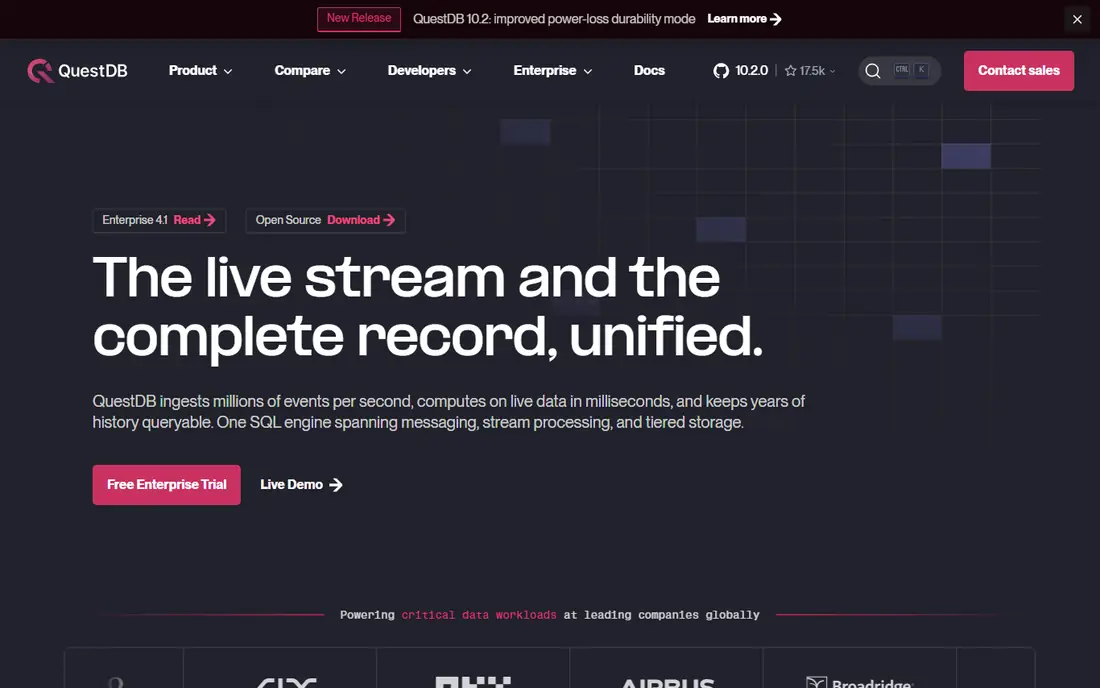
QuestDB is built for high speed ingest and SQL analytics on time ordered data. Teams in finance, energy, and observability use it where large volumes arrive quickly and queries need answers in milliseconds. Its SQL dialect will feel familiar to anyone who writes relational queries, which shortens the learning curve compared with a specialist query language.
The catch is ecosystem size. You will find fewer ready made integrations than you get with Postgres or Prometheus, so some plumbing may fall to your team. If raw speed on a single node matters more than a huge plugin catalog, QuestDB is a strong pick.
- Standard SQL with time series extensions
- Fast ingest and query speed
- Open source core
- Smaller ecosystem than Postgres or Prometheus
- Clustering and enterprise features sit in paid tiers
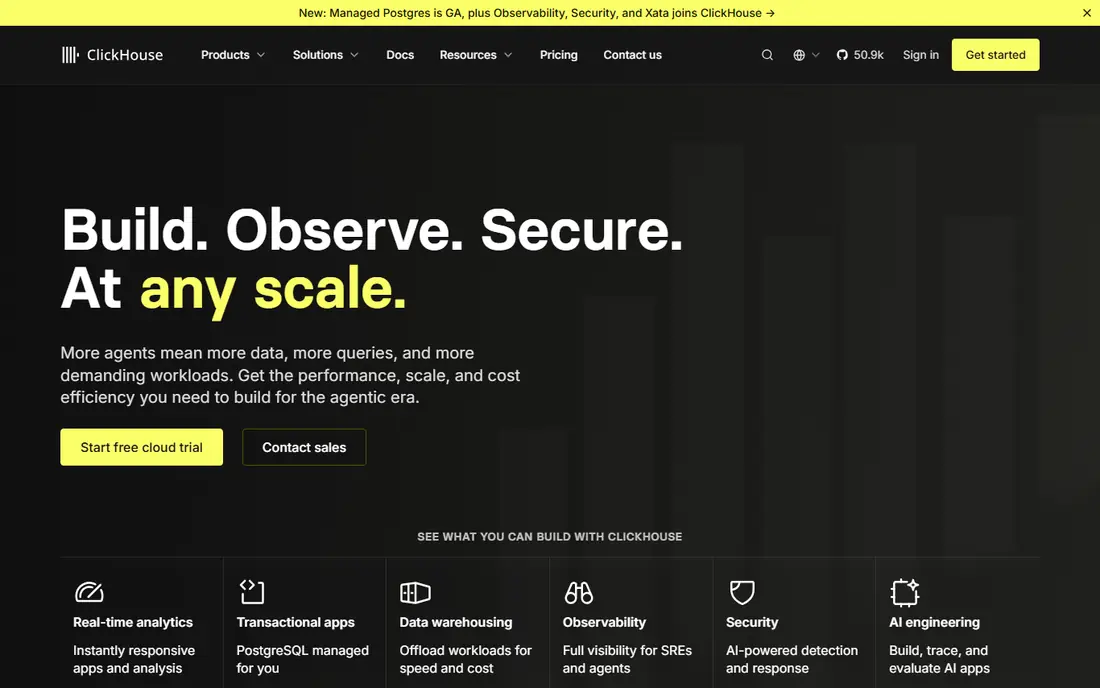
ClickHouse is a column oriented analytical database that handles billions of rows well. It suits teams that need to slice time series data by many dimensions, run ad hoc analysis, and serve dashboards to many users at once. Compression helps keep storage costs in check as data volumes grow, and the managed cloud option removes much of the operating burden.
The downside is complexity. ClickHouse rewards teams that understand its storage and query model, and small projects may find it more than they need. If your workload is mainly analytical rather than simple metric collection, that depth is worth it.
- Very fast analytical queries at scale
- Strong compression
- Open source core with a managed cloud
- More complex to operate than a simple metrics store
- Less suited to tiny single node setups
VictoriaMetrics is known for doing a lot with modest hardware. It accepts Prometheus style metrics, which makes it a natural replacement for teams that already scrape and query with Prometheus tooling. Its efficiency shows up in lower compute and storage bills, especially when retention stretches to months rather than days.
The honest limit is that advanced enterprise features and formal support cost extra, and teams that want a fully managed service need to check the cloud offering. For self hosted monitoring with tight budgets, it is one of the best value options here.
- Low resource use for its workload
- Prometheus compatibility
- Simple single binary option
- Enterprise features and support are paid
- Query language follows Prometheus conventions
Prometheus is the default monitoring choice in Kubernetes environments, and for good reason. Its pull based model, service discovery, and alerting rules fit container workloads well, and the exporter library covers most common systems. If your main need is monitoring rather than general time series analytics, Prometheus is hard to beat for simplicity.
Retention is the weak spot. Prometheus keeps data locally for a limited window by design, so teams that need years of history pair it with a long term store such as Mimir or VictoriaMetrics. Treat it as the collection and alerting layer, not the archive.
- Huge ecosystem and exporter library
- Proven alerting model
- Fully open source
- Local storage is not built for very long retention
- Scaling beyond one server needs extra components
TDengine targets industrial and IoT workloads where thousands of devices send readings at high frequency. It is designed around that data shape, with features for device modeling and efficient storage. Teams in energy, manufacturing, and connected products will find its design closer to their problem than a general purpose database.
Generalist teams may find the ecosystem smaller and the concepts less familiar than Postgres. If your data comes from machines rather than web services, though, TDengine deserves a close look, and its free tier makes a pilot cheap to run.
- Built for high volume sensor data
- Free tier for smaller deployments
- Industrial protocol support
- Less familiar to general web teams
- Enterprise features are paid
Apache Druid is built for user facing analytics on streaming and batch data. It ingests events as they arrive and answers interactive queries quickly, even when data has many dimensions and high cardinality. Product analytics teams and observability platforms use it where dashboards must stay fast under heavy load.
That power comes with operational complexity. Druid is a distributed system with several component types, so running it well takes real engineering time. Smaller teams should only choose it when they genuinely need its interactive query strength.
- Sub second queries on streaming data
- Strong high cardinality handling
- Open source
- Distributed design is complex to run
- Overkill for simple metric storage
CrateDB lets you query time series data together with device metadata in standard SQL, without flattening everything first. That helps when a reading only makes sense next to the device model, location, or owner record. It also supports document style fields and geospatial queries, which suits fleet and asset tracking.
The community is smaller than the Postgres world, so you may write more of your own integration code. For teams that need relational joins on time series data, that trade is often acceptable.
- Standard SQL
- Joins across device data and metadata
- Document and geospatial support
- Smaller community than Postgres
- Managed pricing varies by deployment
Grafana Mimir is the long term storage layer for Prometheus metrics, built to scale horizontally across many servers. Teams that already use Prometheus and Grafana get a natural upgrade path: keep the same query language and dashboards, and gain retention and scale that a single Prometheus server cannot offer.
It is less useful as a standalone general time series database outside a monitoring stack. If Grafana is already your dashboard layer, Mimir fits cleanly. If not, a more general database may serve you better.
- Prometheus compatible queries
- Scales horizontally
- Pairs naturally with Grafana dashboards
- Needs a Grafana centered stack to shine
- Running it yourself takes planning
How we picked these
We compared official feature pages, pricing pages, and documentation for tools that teams commonly name as replacements for InfluxDB, and we checked each vendor homepage to confirm it loads and belongs to the product. We favored tools that are actively maintained, that cover distinct use cases, and that offer a real free or open source starting point. We did not claim hands-on testing, and we avoided repeating vendor performance claims as if they were our own measurements.
What to check before you switch
Match the tool to your query pattern
Monitoring queries, analytical queries, and industrial sensor queries stress different parts of a database. Write down your five most common queries and your retention needs before you shortlist anything. A tool that wins on ingest speed may lose on the joins or aggregations you actually run every day.
Count cardinality and retention honestly
High cardinality, meaning many unique series, is where time series costs explode. Estimate your series count, your ingest rate, and how long you must keep data. Those three numbers drive storage and compute far more than the headline price of any plan.
Plan the migration path
Check which ingest protocols and export formats your current setup uses, and whether the new tool accepts them directly. A clean import path, or a period of dual writing, reduces the risk of gaps in your history. Also confirm your dashboards and alert rules will still work, or budget time to rewrite them.
Price the whole deployment
Open source software is free, but hosting, storage, backups, and support are not. Compare the managed cloud price with the cost of running the same workload yourself, including engineer time. For small teams, a managed service often wins even when the software itself costs nothing.
Sources
Frequently asked questions
What is the best alternative to InfluxDB for most teams?
TimescaleDB is our pick for most teams that already use Postgres, because it keeps standard SQL and a familiar ecosystem. Teams focused purely on monitoring often do better with Prometheus plus VictoriaMetrics or Grafana Mimir for long term storage.
Can I migrate my InfluxDB data to another database?
It depends on the tool and on how your data is shaped. Many of these databases accept common ingest formats and offer migration guides, but you should test a sample export and import before you commit to a full move. Plan for a period of dual writing if continuous history matters.
Which alternative is cheapest to run?
For self hosted use, Prometheus, VictoriaMetrics, and QuestDB are all free at the core and run well on modest hardware for moderate workloads. Costs rise with data volume, retention, and support needs, so the cheapest option for a small deployment may not stay cheapest at scale.
Do I need to know SQL to use these tools?
Not always. Prometheus uses its own query language, and some tools add their own extensions, but TimescaleDB, QuestDB, ClickHouse, and CrateDB all use SQL or a close variant. If your team already writes SQL, that narrows the learning curve a lot.
Which option handles IoT sensor data best?
TDengine and TimescaleDB are strong for sensor and industrial data, with TDengine built specifically around high volume device streams. QuestDB also suits high frequency sensor feeds where fast SQL analytics matter.
Is ClickHouse a direct replacement for InfluxDB?
ClickHouse can store and query time series data well, but it is a general analytical database rather than a specialist time series store. It fits best when your workload is analytical, with many dimensions and ad hoc queries, rather than simple metric collection and alerting.