Databox Alternatives in 2026: 9 Tools Compared
By ToolNimba Editorial Team November 13, 2026 10 min read

- Top pick
 Klipfolio
Precise custom dashboards
Starting priceSee websiteCheck out KlipfolioRead our review - Runner-up
 Geckoboard
Live TV KPI displays
Starting priceSee websiteCheck out GeckoboardRead our review - Also great
 DashThis
Fast client reports
Starting priceSee websiteCheck out DashThisRead our review
How we researched this
We compared official pricing and feature pages, app store listings, privacy policies and public user reviews. Prices change, so check the provider's site before you pay.
Key takeaways
- Klipfolio suits teams that want precise control over each dashboard widget, while Geckoboard suits live TV displays.
- DashThis and AgencyAnalytics are the most agency-friendly picks, with client reporting and white-label options built in.
- Looker Studio is the best free starting point, especially if your data already lives in Google tools.
- Power BI and Tableau suit larger teams that need deeper analysis, not just a KPI wall.
- Price depends on dashboards, clients, and data sources, so compare the total for your roster, not just the headline plan.
Quick comparison
| Name | Best for | Starting price | Free plan | |
|---|---|---|---|---|
| Klipfolio | Precise custom dashboards | See website | Free trial | Visit |
| Geckoboard | Live TV KPI displays | See website | Free trial | Visit |
| DashThis | Fast client reports | See website | Free trial | Visit |
 AgencyAnalytics | SEO and marketing agencies | See website | Free trial | Visit |
 Whatagraph | White-label agency reporting | See website | Free trial | Visit |
 Looker Studio | Free Google-based reporting | Free | Yes | Visit |
 Microsoft Power BI | Microsoft-centric teams | See website | Yes | Visit |
 Tableau | Deep visual analysis | See website | Free trial | Visit |
 Metabase | Database dashboards on a budget | Free | Yes | Visit |
The best databox alternatives
Databox is known for KPI dashboards that pull metrics from marketing, sales, and product tools into one view. The alternatives below cover the same job from different angles: some are built for agencies, some for TV wallboards, some for deep analysis, and one is free. None of them is Databox itself, and each is judged on integrations, dashboard control, reporting, and price structure.
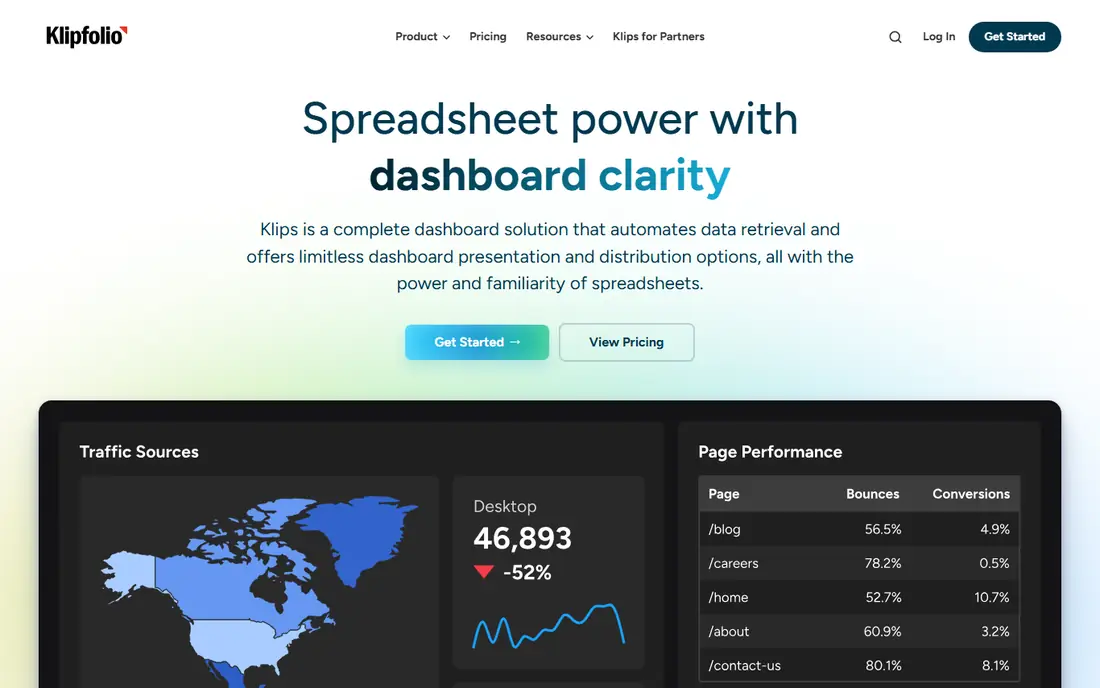
Klipfolio is the pick for teams that want to build a dashboard exactly how they imagined it. Its Klips widget system gives control over formulas, layouts, and data sources, which suits analysts who need a custom metric, not just a template. Scheduled reports and client sharing make it workable for agencies, and the integration list covers the usual marketing and sales tools.
That control has a cost in time. A non-technical user may find template-led rivals faster for a first dashboard, and Klipfolio rewards a person who enjoys building. If you have an analyst or a technically minded marketer, Klipfolio is powerful. If you need a report in ten minutes, DashThis will feel easier.
- Fine-grained widget control with Klips
- Many integrations
- Scheduled reports for clients
- Setup takes more analyst time than template-led tools
- Pricing rises with dashboards and clients
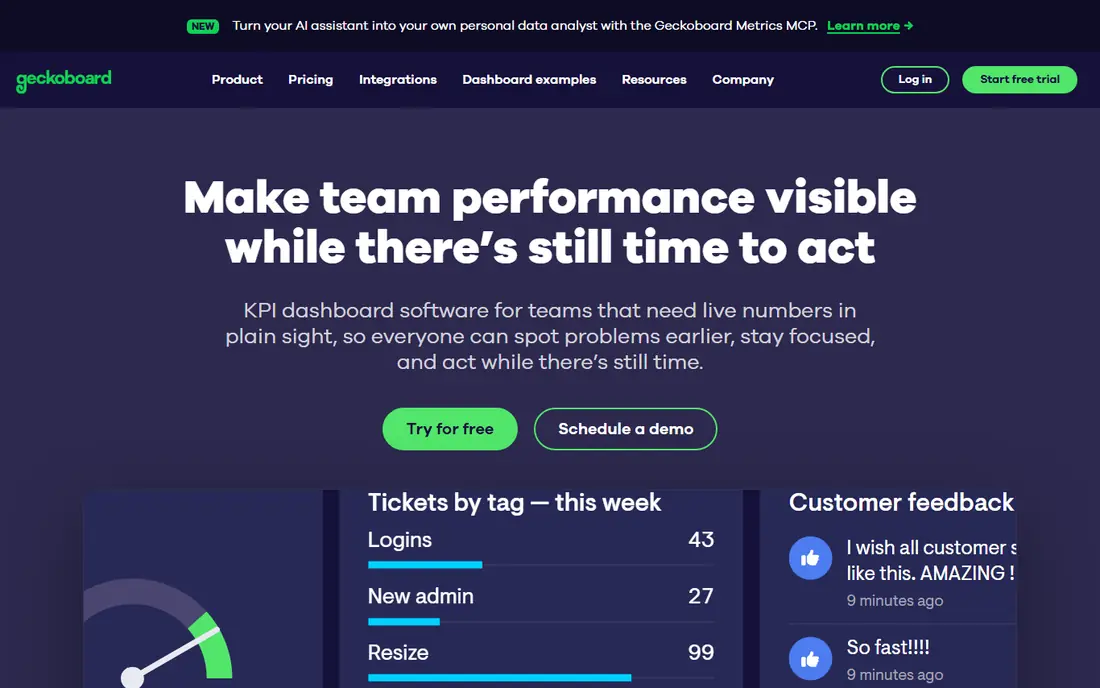
Geckoboard is built for a specific job: numbers on a screen that a whole office can read at a glance. Sales, support, and operations teams use it for TV wallboards that update live, with large, clear widgets and little clutter. Setup is simpler than a full BI tool, because the goal is visibility, not exploration.
It is not the best tool for a detailed client report or for slicing data in many ways. If your main need is a live wallboard, Geckoboard is hard to beat for clarity. If you need printable reports and deep analysis, pair it with, or choose, a reporting or BI tool instead.
- Purpose-built TV mode
- Live KPI displays for offices
- Simple, readable layouts
- Less suited to deep analysis or printed client reports
- No free plan, trial only
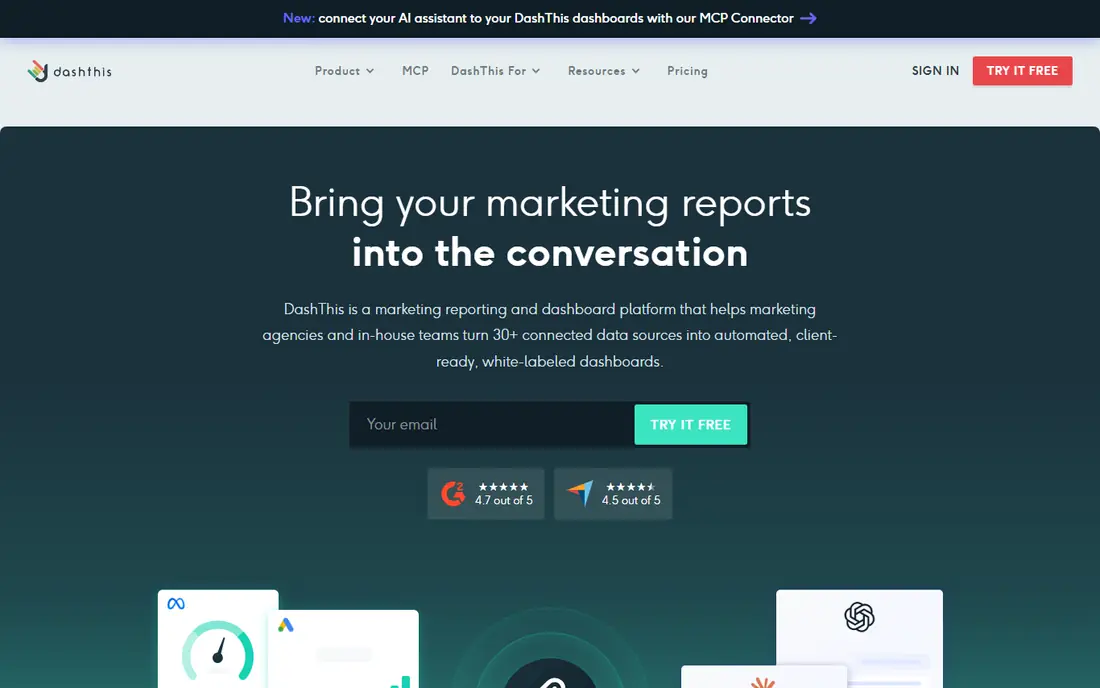
DashThis is the speed pick. Its templates let a freelancer or small agency build a clean, client-ready marketing report in minutes, with data from ad platforms, analytics, and social tools. That matters when you report to many clients each month and setup time eats your margin. White-label options on higher tiers let the report carry your brand, not the vendor's.
The trade-off is depth. DashThis is a reporting tool, not a full BI platform, so teams that need complex modeling or ad hoc exploration will hit limits. For recurring client reports, though, speed and clarity are the point, and DashThis delivers both.
- Very fast report setup from templates
- Client-ready layouts
- White-label on higher tiers
- Less deep analysis than Power BI or Tableau
- Pricing grows with dashboards
AgencyAnalytics is built for agencies from the ground up. Pricing per client makes the cost easy to pass on, white-label reporting is included, and native SEO tools like rank tracking and site audits mean an SEO agency does not need a separate rank tracker for basic reporting. Integrations cover the marketing tools agencies actually use.
The per-client model is both a strength and a cost. A small roster is affordable, while a large roster needs a careful total. Internal teams that do not bill clients may prefer a flat-rate dashboard tool. For agencies, especially SEO and content agencies, AgencyAnalytics is one of the closest like-for-like replacements.
- Per-client pricing that scales with your roster
- Native rank tracking and site audits
- White-label included
- Pricing is per client, so a large roster adds up
- Less suited to non-agency internal dashboards
Whatagraph targets agencies that treat the report itself as part of the product. Reports look polished, white-labeling is central, and custom metrics let an agency define success the way a client understands it. For larger agencies with many clients and a brand to protect, that polish justifies the price.
Smaller agencies may find the entry price high compared with DashThis. Whatagraph makes most sense when report quality wins clients, or when you need consistent, branded reporting across a large roster. If you only need internal dashboards, a cheaper tool will serve you as well.
- Polished white-label reports
- Custom metrics and templates
- Built for agencies at scale
- Higher entry price than DashThis or AgencyAnalytics
- Best value on larger agency plans
Looker Studio, formerly Google Data Studio, is the best free alternative for teams whose data already lives in Google tools. Reports for Analytics, Ads, Search Console, and Sheets are straightforward, sharing is simple, and viewers do not need a paid seat. For a small business or freelancer, that free core covers a lot of reporting.
The limit is non-Google data. Many other platforms need a paid partner connector, which can erase the free advantage if your stack is diverse. White-labeling is also manual rather than built in. If your data is mostly Google, Looker Studio is the obvious first try. If it is not, budget for connectors or pick a tool with native integrations.
- Free to build and view reports
- Strong Google Analytics, Ads, and Sheets connections
- Easy sharing
- Non-Google sources often need paid connectors
- White-labeling needs manual work
Power BI suits teams that live in Microsoft 365 and Excel. The free desktop app lets an analyst build rich reports with Power Query modeling, and the cloud service shares them across the organization. For finance, operations, and sales teams that already use Excel, Power BI feels like a natural step up from spreadsheets.
Sharing is where the cost appears, since viewers and publishers generally need a paid license. The full modeling features also take time to learn. If your team is Microsoft-centric and needs analysis, not just a KPI wall, Power BI is a strong, scalable choice. If you only need a simple dashboard, a lighter tool will be faster.
- Deep data modeling with Power Query
- Strong Microsoft 365 and Excel integration
- Free desktop app
- Sharing needs paid per-user licenses
- Learning curve for full modeling features
Tableau is the analyst's tool on this list. It excels at exploring data visually, testing hypotheses, and building interactive dashboards that invite questions, not just display answers. Teams with a data analyst, or with complex data that needs slicing by region, product, and time, will get value that a template dashboard cannot offer.
That power costs money and time. Tableau is overkill for a team that only wants a daily KPI snapshot, and its pricing is per user, so a large viewer group adds up. Choose Tableau when analysis is the job. Choose a dashboard tool when display is the job.
- Best-in-class visual exploration
- Strong for analysts who slice data many ways
- Large community and resources
- Higher price and learning curve than dashboard-only tools
- Overkill for a simple KPI wall
Metabase is different from most tools here, because it queries your own database rather than pulling from SaaS apps. The question builder lets non-technical users ask questions without SQL, while analysts can write SQL directly. The open-source version is free to self-host, which makes it attractive for startups and technical teams on a budget.
The catch is setup and scope. You need a database and someone to maintain the instance, and SaaS marketing integrations are not its strength. If your key data lives in Postgres, MySQL, or a warehouse, Metabase is a smart, low-cost dashboard. If your data lives in ad platforms and CRMs, pick a SaaS dashboard tool instead.
- Free self-hosted open-source version
- Question builder for non-SQL users
- SQL editor for analysts
- Cloud pricing starts higher than some rivals
- Needs a database to query, not just SaaS integrations
How we picked these
We compared official feature pages, pricing pages, and integration lists for dashboard and reporting tools that cover the same KPI and client-reporting job, and we favored tools with a live product, clear pricing or trial, and a current homepage. We did not claim hands-on testing, and we excluded Databox itself, since this is an alternatives list. Price figures change often, so we list "See website" where a single figure would mislead, and we note free tiers where they are clearly offered.
How to choose a Databox alternative
Start with your audience. An agency needs white-label client reports and per-client pricing, while an internal team needs a wallboard or an analysis tool. Next, list your data sources and check native integrations, because a paid connector for every source can double the real cost. Then count dashboards, clients, and viewers, and total the price for that roster, not just for one dashboard.
Trial the top two on real data, not sample data, and judge them on one question: does anyone look at the dashboard after week two? A dashboard nobody opens is a cost, not a tool. Pick the tool that fits your team's building skill, whether that is a template, a widget builder, or a full BI model, and keep the number of tools low.
A simple shortlist by team type
Agencies should shortlist DashThis, AgencyAnalytics, and Whatagraph. Internal teams with Google data should start with Looker Studio. Microsoft teams should try Power BI, data teams should try Tableau, and database-led teams should try Metabase. Geckoboard stays the pick for a live office wallboard.
Sources
Frequently asked questions
What is the best Databox alternative overall?
There is no single winner. DashThis is fastest for client reports, Klipfolio offers the most widget control, Looker Studio is best free, and Power BI and Tableau suit deeper analysis. Match the tool to your audience and data sources.
Are there free alternatives to Databox?
Yes. Looker Studio is free for building and viewing reports, and Metabase offers a free self-hosted open-source version. Both have limits, especially for non-Google sources or for managed hosting.
Which alternative is best for agencies?
AgencyAnalytics and DashThis are built for agency reporting, with white-label options and per-client or per-dashboard pricing. Whatagraph suits larger agencies that need polished, branded reports at scale.
Can I use Looker Studio instead of Databox?
Yes, if your data is mostly in Google tools. For many non-Google platforms you will need a paid connector, so check your full source list before switching.
Do these tools replace a full BI platform?
Dashboard tools display KPIs well, but Power BI, Tableau, and Metabase offer deeper modeling and exploration. If you need complex analysis, choose a BI tool, not just a dashboard tool.
How much do Databox alternatives cost?
It varies widely, from free for Looker Studio and self-hosted Metabase to per-user or per-client pricing for agency and BI tools. Total the cost for your dashboards, clients, and viewers before you commit.